. 2025 Aug 13;15(1):29714.
doi: 10.1038/s41598-025-13798-3.

HNF4A ameliorates acute liver failure by inhibiting NCOA4-mediated ferritinophagy

Affiliations

HNF4A ameliorates acute liver failure by inhibiting NCOA4-mediated ferritinophagy

Weiyan Yu et al. Sci Rep. .

Abstract

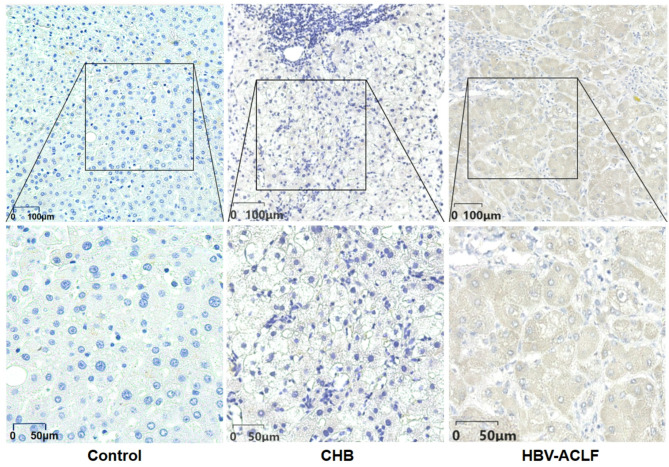
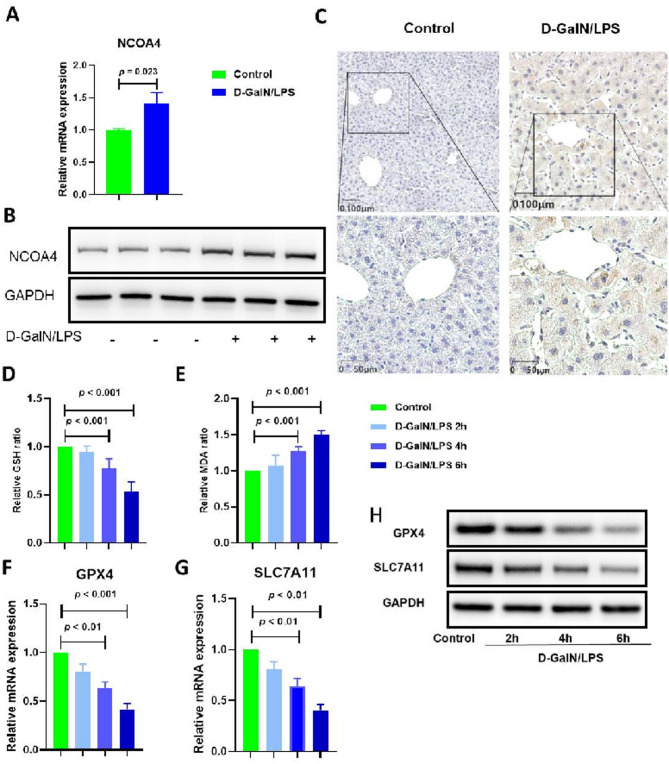
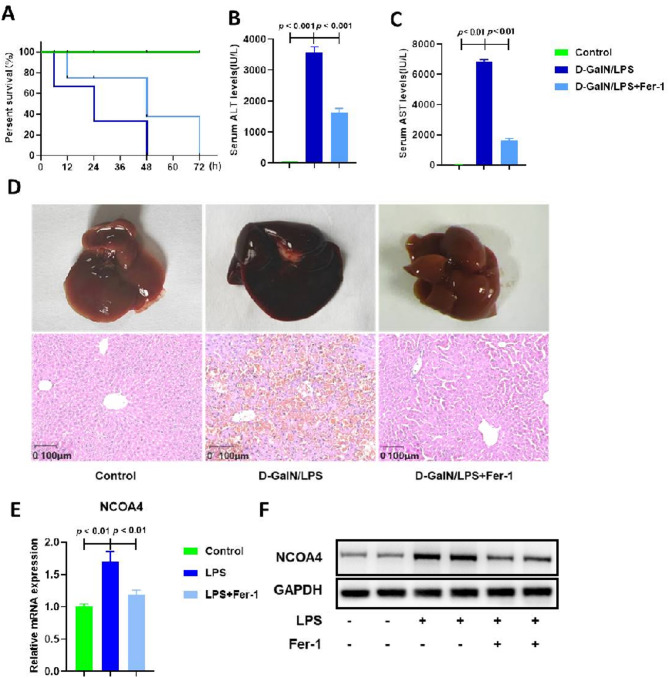
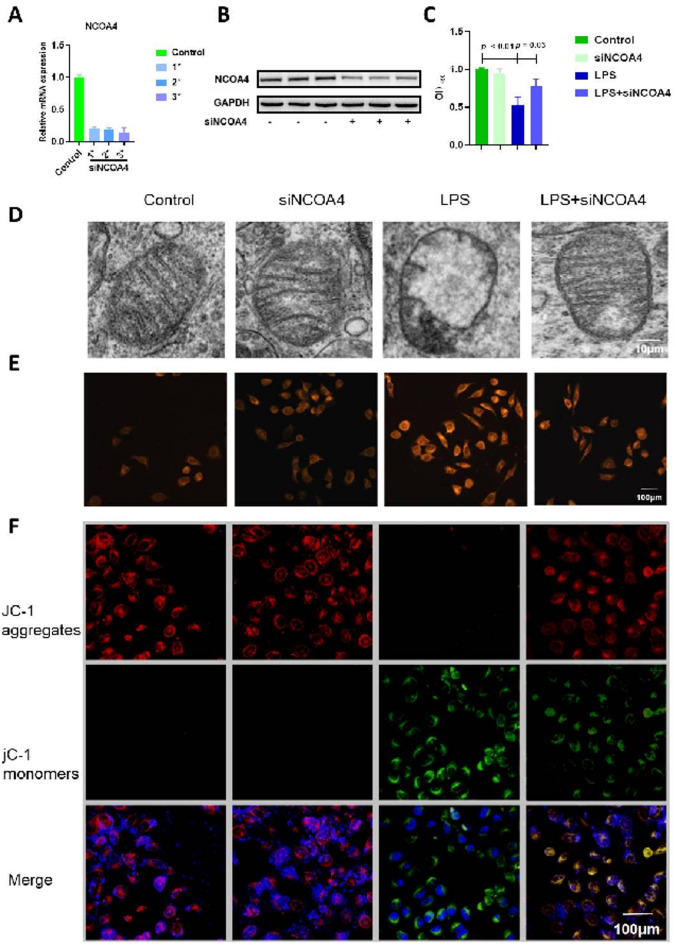
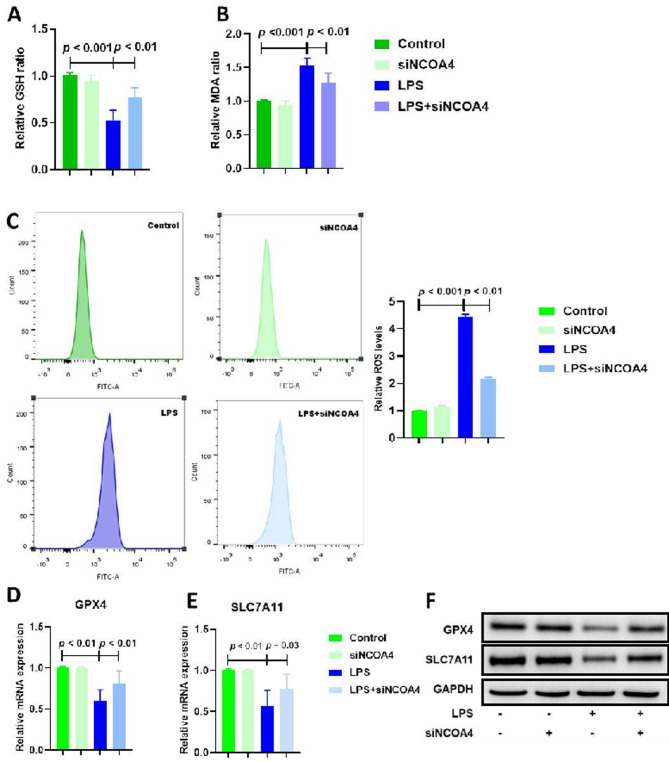
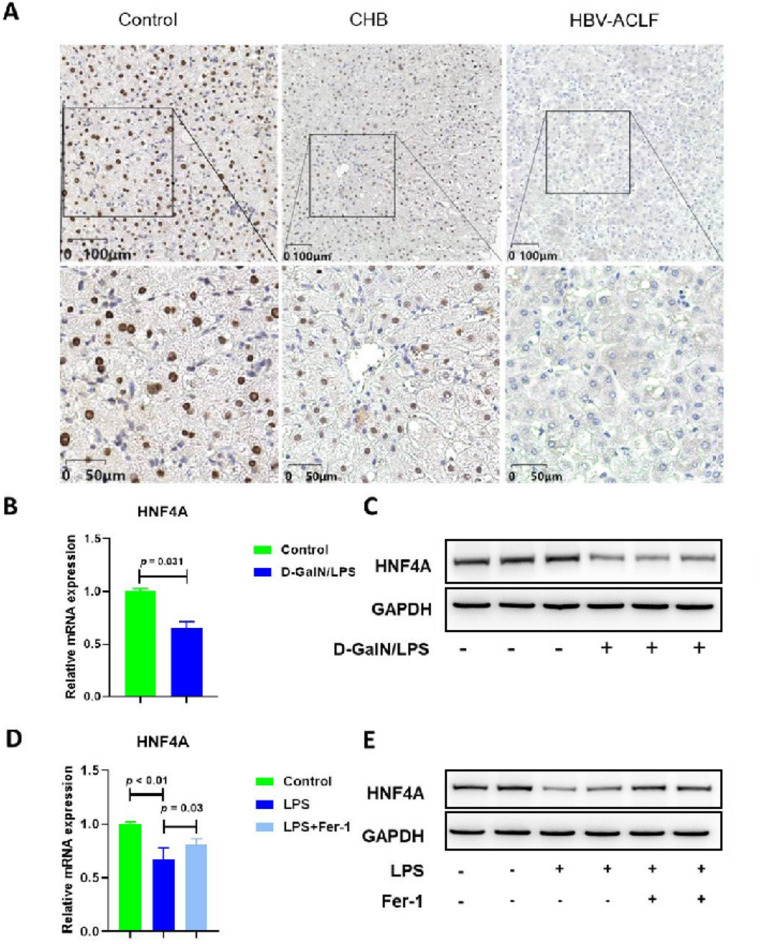
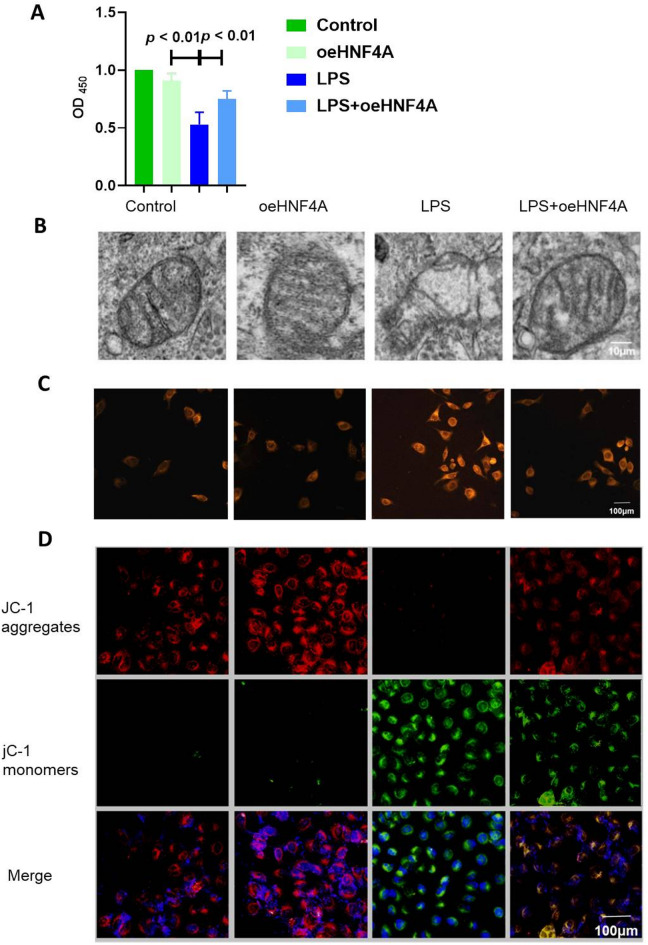
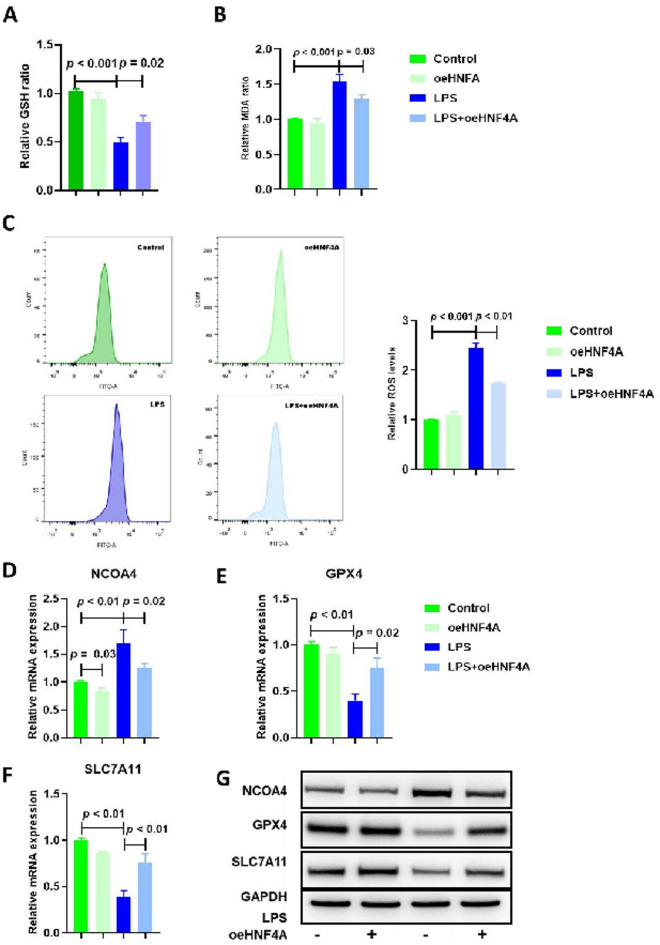
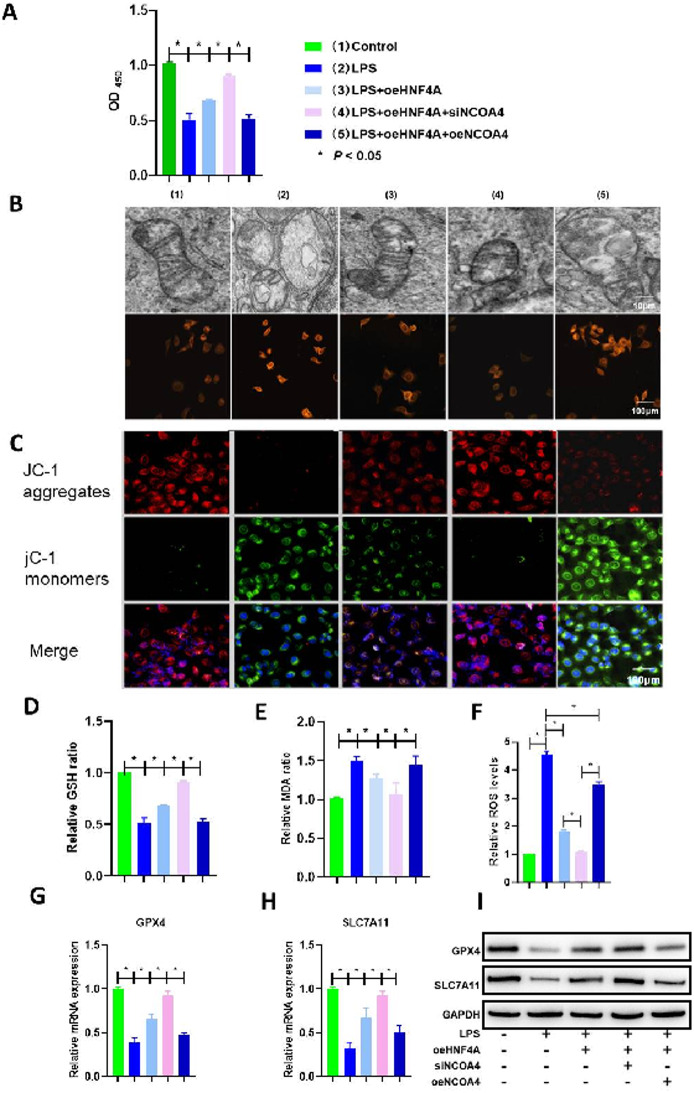
Intracellular iron homeostasis imbalance is linked to cellular ferroptosis and inflammatory injury diseases. NCOA4-mediated ferritin autophagy is vital for regulating intracellular iron homeostasis, but its impact on acute liver failure (ALF) pathogenesis and regulatory mechanisms remain unclear. This study explores the role and regulatory mechanisms of NCOA4 in hepatocyte ferroptosis and ALF progression. To investigate the relationship between NCOA4 expression and acute liver failure (ALF), we compared the protein expression levels in normal and pathological liver tissues. By establishing cell and mouse models, we determined the correlation among NCOA4 expression, ferroptosis, and inflammatory liver injury. Additionally, we explored the regulatory effect of NCOA4 on hepatocyte ferroptosis by interfering with gene expression and observing mitochondrial structure changes. Finally, we evaluated the regulation of NCOA4 expression and its protective effect against acute inflammatory injury in hepatocytes. Our results showed that NCOA4 expression was significantly higher in patients with hepatitis B virus - related acute - on - chronic liver failure (HBV - ACLF) compared to those with chronic hepatitis B. Similarly, NCOA4 was upregulated in ALF model mice and inflammatory hepatocytes. Silencing NCOA4 alleviated LPS - induced ferroptosis in inflammatory hepatocytes. Mechanistic research indicated that the transcription of hepatic nuclear factor 4 A (HNF4A) negatively regulated NCOA4. HNF4A transcriptionally inhibited NCOA4 expression, reducing hepatocyte ferroptosis through anti - ferritin autophagy. This study identified the HNF4A - NCOA4 axis and ferritinophagy as crucial factors in hepatocyte ferroptosis and the pathogenesis of acute liver failure (ALF). These findings suggest that the HNF4A - NCOA4 axis could be a potential therapeutic target for ALF.

Keywords: Acute liver failure; Ferroptosis; Hepatocyte; Hepatocyte nuclear factor 4A; Nuclear receptor coactivator 4.


Conflict of interest statement

Declarations statement: The research in this paper adheres to the Declaration of Helsinki Competing interests: The authors declare no competing interests. Conflict of interest: The authors declare that they have no conflicts of interest. Ethical approval: This study protocol was approved by the Medical ethics committee of the Third Hospital of Hebei Medical University (2024-052-1). Informed consent: All patients obtained written informed consent.

Figures

Fig. 1
Fig. 1
Immunohistochemical analysis of NCOA4 protein expression levels across different groups. One-way ANOVA was performed to analyze the differences in NCOA4 protein expression among normal controls, CHB patients, and HBV - ACLF patients. The results showed significant differences among the groups (F = 8.523, P < 0.001). Tukey’s post - hoc test indicated that the NCOA4 protein expression was significantly higher in HBV - ACLF patients compared to normal controls (P = 0.015) and CHB patients (P = 0.021).
Fig. 2
Fig. 2
Increased NCOA4 expression and associated liver injury in ALF model mice. A: NCOA4 mRNA expression in liver tissues of control and ALF model mice; one-way ANOVA showed significant differences between groups (F = 10.256, P < 0.001), with Tukey’s post-hoc test indicating significantly higher NCOA4 mRNA levels in the ALF model group compared to the control group (P = 0.008). B: NCOA4 protein expression in liver tissues of control and ALF model mice (Western Blot); one-way ANOVA revealed significant differences (F = 9.147, P < 0.001), and Tukey’s post-hoc test demonstrated significantly increased NCOA4 protein levels in the ALF model group (P = 0.011). C: Immunohistochemical staining of NCOA4 in liver tissues of control and ALF model mice (scale bar: 50 μm). D: GSH levels in liver tissues of ALF model mice at 2 h, 4 h, and 6 h post-D-GalN/LPS treatment; one-way ANOVA showed significant differences (F = 12.365, P < 0.001), with Tukey’s post-hoc test indicating significantly lower GSH levels in the ALF model group compared to the control group (P = 0.005) and a gradual decrease with prolonged treatment. E: MDA levels in liver tissues of ALF model mice at 2 h, 4 h, and 6 h post-D-GalN/LPS treatment; one-way ANOVA revealed significant differences (F = 15.489, P < 0.001), and Tukey’s post-hoc test demonstrated significantly higher MDA levels in the ALF model group compared to the control group (P = 0.003) and a progressive increase over time. F: GPX4 mRNA expression in liver tissues of ALF model mice at 2 h, 4 h, and 6 h post-D-GalN/LPS treatment; one-way ANOVA showed significant differences (F = 11.024, P < 0.001), with Tukey’s post-hoc test indicating significantly lower GPX4 mRNA levels in the ALF model group compared to the control group (P = 0.006) and a decrease with prolonged treatment (e.g., 6 h vs. 2 h, P = 0.012). G: SLC7A11 mRNA expression in liver tissues of ALF model mice at 2 h, 4 h, and 6 h post-D-GalN/LPS treatment; one-way ANOVA revealed significant differences (F = 10.876, P < 0.001), and Tukey’s post-hoc test demonstrated significantly reduced SLC7A11 mRNA levels in the ALF model group (P = 0.007) and a progressive decrease over 6 h (e.g., 6 h vs. 2 h, P = 0.015). H: GPX4 and SLC7A11 protein expression in liver tissues of control and ALF model mice (Western Blot); one-way ANOVA showed significant differences for GPX4 (F = 9.873, P < 0.001) and SLC7A11 (F = 10.567, P < 0.001), with Tukey’s post-hoc test indicating significantly lower levels of both proteins in the ALF model group (GPX4: P = 0.013; SLC7A11: P = 0.010). n = 5.
Fig. 3
Fig. 3
Protective Effect of Ferrostatin-1 (Fer-1) on Acute Liver Failure (ALF) in mice. A: Survival curves of mice in control, ALF model (D-GalN/LPS), and Fer-1-treated groups (n = 6); median survival time was significantly longer in the Fer-1 group (48 h vs. 24 h, P = 0.033). B: Serum ALT levels in each group; Fer-1 treatment significantly reduced ALT compared to the ALF model group (P = 0.025, Student’s t-test). C: Serum AST levels in each group; Fer-1 treatment significantly reduced AST compared to the ALF model group (P = 0.028, Student’s t-test). D: Gross morphology and HE staining of liver tissues (scale bar: 100 μm); Fer-1 mitigated inflammatory damage in ALF model mice. E: NCOA4 mRNA expression in LPS-induced L02 cells with/without Fer-1 treatment (detected by RT-PCR); Fer-1 significantly downregulated NCOA4 (P = 0.018, Student’s t-test). F: NCOA4 protein expression in LPS-induced L02 cells with/without Fer-1 treatment (detected by Western Blot); Fer-1 significantly reduced NCOA4 protein levels (P = 0.021, Student’s t-test). n = 6.
Fig. 4
Fig. 4
Impact of siNCOA4 on cellular responses in LO2 cells. A: NCOA4 mRNA expression in LO2 cells after siNCOA4 transfection (detected by RT-PCR); silencing efficiency was verified (P < 0.01). B: NCOA4 protein expression in LO2 cells after siNCOA4 transfection (detected by Western Blot); silencing efficiency was confirmed (P = 0.03). C: Cell viability in control, siNCOA4, LPS, and LPS + siNCOA4 groups (assessed by CCK-8 assay); siNCOA4 reversed LPS-induced viability reduction (P = 0.020, one-way ANOVA). D: Mitochondrial morphology in each group (observed by transmission electron microscopy, scale bar: 10 μm); siNCOA4 alleviated LPS-induced mitochondrial deformation. E: Intracellular Fe²⁺ levels (detected by FerroOrange staining, scale bar: 100 μm); siNCOA4 reduced LPS-induced Fe²⁺ accumulation (P = 0.015, one-way ANOVA). F: Mitochondrial membrane potential (assessed by JC-1 fluorescence, scale bar: 100 μm); siNCOA4 restored LPS-reduced membrane potential (P = 0.018, one-way ANOVA). n = 5.
Fig. 5
Fig. 5
Biochemical changes induced by siNCOA4 in different groups. A: Relative GSH levels in each group; siNCOA4 increased GSH in LPS-treated cells (P = 0.022, one-way ANOVA). B: MDA levels ratio in each group; siNCOA4 decreased MDA in LPS-treated cells (P = 0.019, one-way ANOVA). C: Intracellular ROS levels (detected by DCFH-DA and flow cytometry); siNCOA4 reversed LPS-induced ROS accumulation (P < 0.01). D: GPX4 mRNA expression in each group (detected by RT-PCR); siNCOA4 upregulated GPX4 in LPS-treated cells (P = 0.016, one-way ANOVA). E: SLC7A11 mRNA expression in each group (detected by RT-PCR); siNCOA4 upregulated SLC7A11 in LPS-treated cells (P = 0.017, one-way ANOVA). F: GPX4 and SLC7A11 protein expression (detected by Western Blot); siNCOA4 increased both proteins in LPS-treated cells (P < 0.02, one-way ANOVA). n = 5.
Fig. 6
Fig. 6
HNF4A expression in liver tissue across different groups. A: One - way ANOVA was performed to analyze the HNF4A protein expression levels among normal controls, CHB patients, and HBV - ACLF patients. The overall F - value was 12.567 (P < 0.001). Tukey’s post - hoc test showed that the HNF4A protein expression in the HBV - ACLF group was significantly lower than that in the normal control group (P = 0.031) and lower than the CHB group (P = 0.035). B: For the HNF4A mRNA levels after D - GalN/LPS treatment, one - way ANOVA was carried out between the D - GalN/LPS group and the control group. The F - value was 11.345 (P < 0.001). Tukey’s post - hoc test indicated that the HNF4A mRNA levels in the D - GalN/LPS group were significantly lower than those in the control group (P = 0.027). C: In the Western Blot assessment of HNF4A protein expression after D - GalN/LPS treatment, one - way ANOVA had an F - value of 10.897 (P < 0.001). Tukey’s post - hoc test revealed that the HNF4A protein levels in the D - GalN/LPS group were significantly lower than those in the control group (P = 0.029). D: For the HNF4A mRNA levels after LPS and Fer − 1 treatment, one - way ANOVA among the LPS and LPS + Fer − 1 groups had an F - value of 9.876 (P < 0.001). Tukey’s post - hoc test showed that the HNF4A mRNA levels in the LPS + Fer − 1 group were significantly higher than those in the LPS group (P = 0.020). E: Regarding the HNF4A protein expression after LPS and Fer − 1 treatment, one - way ANOVA had an F - value of 10.234 (P < 0.001). Tukey’s post - hoc test indicated that the HNF4A protein levels in the LPS + Fer − 1 group were significantly higher than those in the LPS group (P = 0.023).
Fig. 7
Fig. 7
Cellular Impact of HNF4A Overexpression (oeHNF4A) in LO2 Cells. A: Cell viability in control, oeHNF4A, LPS, and LPS + oeHNF4A groups (assessed by CCK-8 assay); oeHNF4A reversed LPS-induced viability reduction (P = 0.025, one-way ANOVA). B: Mitochondrial morphology in each group (observed by transmission electron microscopy, scale bar: 10 μm); oeHNF4A alleviated LPS-induced mitochondrial deformation. C: Intracellular Fe²⁺ levels (detected by FerroOrange staining, scale bar: 100 μm); oeHNF4A reduced LPS-induced Fe²⁺ accumulation (P = 0.017, one-way ANOVA). D: Mitochondrial membrane potential (assessed by JC-1 fluorescence, scale bar: 100 μm); oeHNF4A restored LPS-reduced membrane potential (P = 0.019, one-way ANOVA). n = 5.
Fig. 8
Fig. 8
Analysis of Oxidative Stress and Gene Expression in Different Groups. A: Relative GSH levels in each group; oeHNF4A increased GSH in LPS-treated cells (P = 0.024, Student’s t-test). B: MDA ratio in each group; oeHNF4A decreased MDA in LPS-treated cells (P = 0.021, Student’s t-test). C: Intracellular ROS levels (detected by flow cytometry); oeHNF4A reversed LPS-induced ROS accumulation (P = 0.018, Student’s t-test). D: NCOA4 mRNA expression (detected by RT-PCR); oeHNF4A downregulated NCOA4 in LPS-treated cells (P = 0.016, Student’s t-test). E: NCOA4 protein expression (detected by Western Blot); oeHNF4A reduced NCOA4 in LPS-treated cells (P = 0.015, Student’s t-test). F: GPX4 mRNA expression (detected by RT-PCR); oeHNF4A upregulated GPX4 in LPS-treated cells (P = 0.017, Student’s t-test). G: SLC7A11 mRNA expression (detected by RT-PCR); oeHNF4A upregulated SLC7A11 in LPS-treated cells (P = 0.018, Student’s t-test). H: GPX4 and SLC7A11 protein expression (detected by Western Blot); oeHNF4A increased both proteins in LPS-treated cells (P < 0.02, Student’s t-test). n = 5.
Fig. 9
Fig. 9
Impact of siNCOA4 and HNF4A Overexpression (oeHNF4A) on Cellular Responses. A: Cell viability in control, LPS, LPS + oeHNF4A, LPS + oeHNF4A + siNCOA4, and LPS + oeHNF4A + oeNCOA4 groups; combined oeHNF4A and siNCOA4 synergistically increased viability (P = 0.010, one-way ANOVA). B: Intracellular Fe²⁺ levels (scale bar: 100 μm); combined treatment reduced LPS-induced Fe²⁺ deposition (P = 0.012, one-way ANOVA). C: Mitochondrial membrane potential (JC-1 fluorescence); combined treatment restored LPS-reduced potential (P = 0.014, one-way ANOVA). D: GSH levels; combined treatment increased GSH in LPS-treated cells (P = 0.016, one-way ANOVA). E: MDA ratio; combined treatment decreased MDA in LPS-treated cells (P = 0.018, one-way ANOVA). F: Intracellular ROS levels; combined treatment reduced LPS-induced ROS (P = 0.015, one-way ANOVA). G: GPX4 mRNA expression; combined treatment upregulated GPX4 (P = 0.013, one-way ANOVA). H: SLC7A11 mRNA expression; combined treatment upregulated SLC7A11 (P = 0.014, one-way ANOVA). I: GPX4 and SLC7A11 protein expression; combined treatment increased both proteins (P < 0.02, one-way ANOVA). n = 5.

Similar articles

References

    1. Mao, L. et al. The emerging role of ferroptosis in non-cancer liver diseases: hype or increasing hope? Cell Death Dis.11 (7), 518 (2020). - PMC - PubMed
    1. Chen, J., Li, X., Ge, C., Min, J. & Wang, F. The multifaceted role of ferroptosis in liver disease. Cell. Death Differ.29 (3), 467–480 (2022). - PMC - PubMed
    1. Lemmer, P., Sowa, J. P., Bulut, Y., Strnad, P. & Canbay, A. Mechanisms and aetiology-dependent Treatment of Acute Liver Failure. Liver International (official journal of the International Association for the Study of the Liver, 2023). - PMC - PubMed
    1. Xie, D. & Ouyang, S. The role and mechanisms of macrophage polarization and hepatocyte pyroptosis in acute liver failure. Front. Immunol.14, 1279264 (2023). - PMC - PubMed
    1. Stravitz, R. T. & Lee, W. M. Acute liver failure. Lancet (London England). 394 (10201), 869–881 (2019). - PMC - PubMed

LinkOut - more resources