. 2025 Aug 13;15(1):29760.
doi: 10.1038/s41598-025-14631-7.

Chondroitin sulfate protects against synaptic impairment caused by fluorosis through the Erk1/2-MMP-9 signaling pathway

Affiliations

Chondroitin sulfate protects against synaptic impairment caused by fluorosis through the Erk1/2-MMP-9 signaling pathway

Fujun Ai et al. Sci Rep. .

Abstract

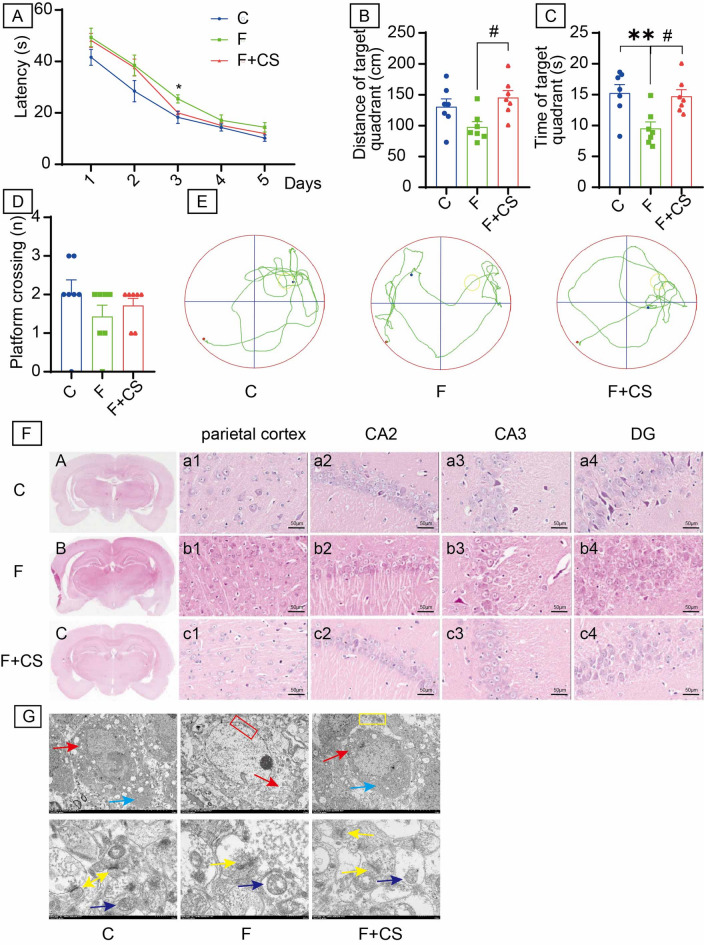
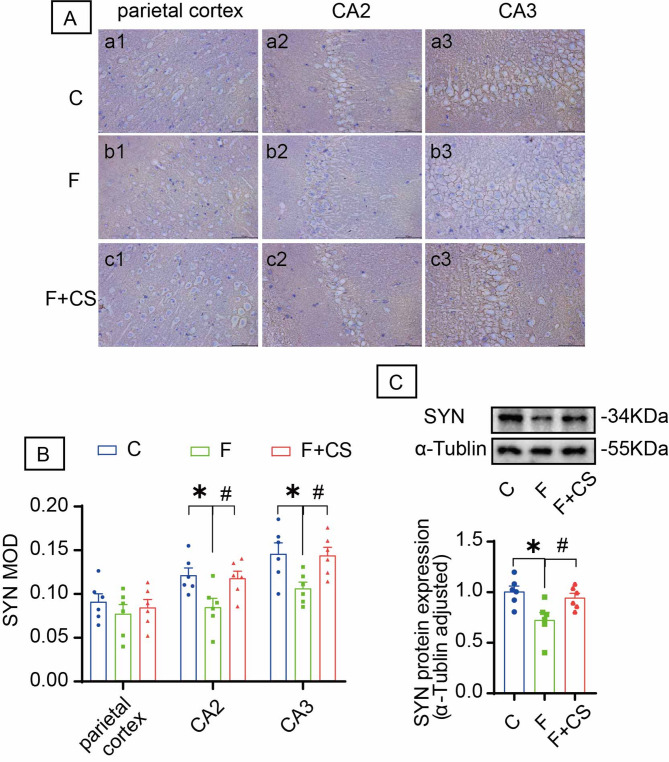
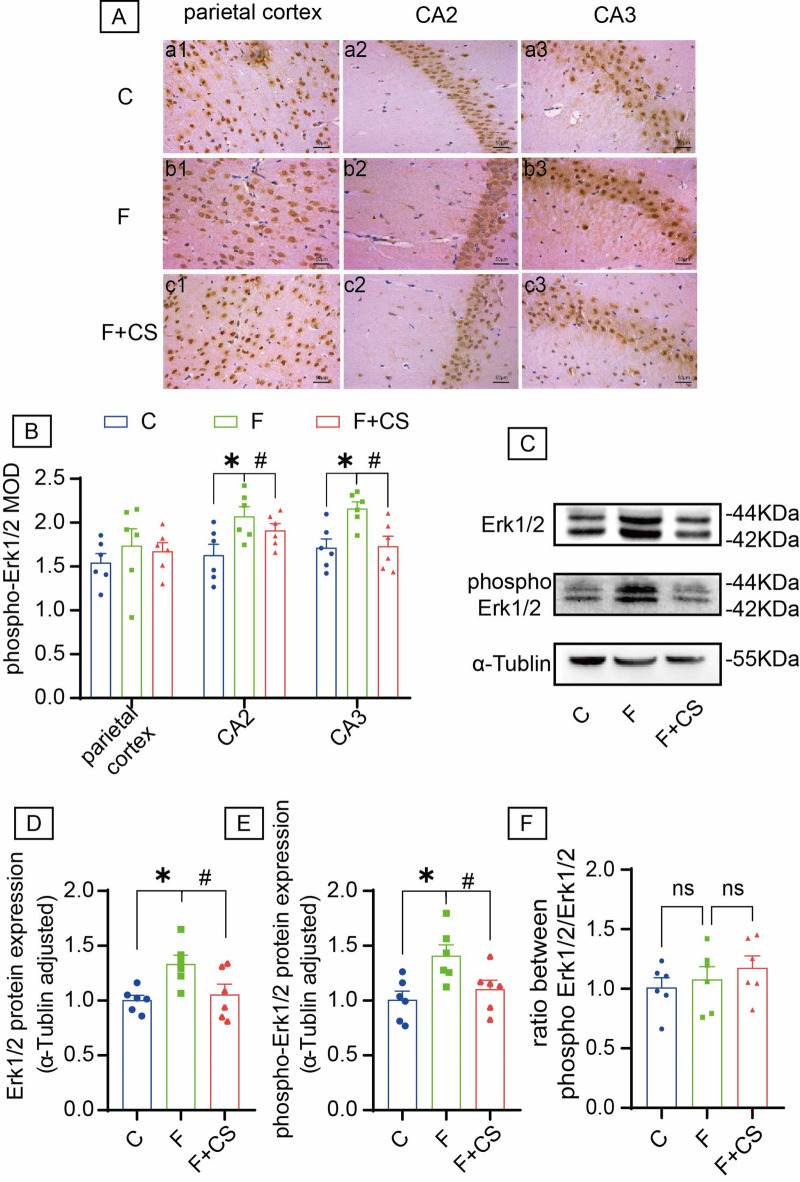
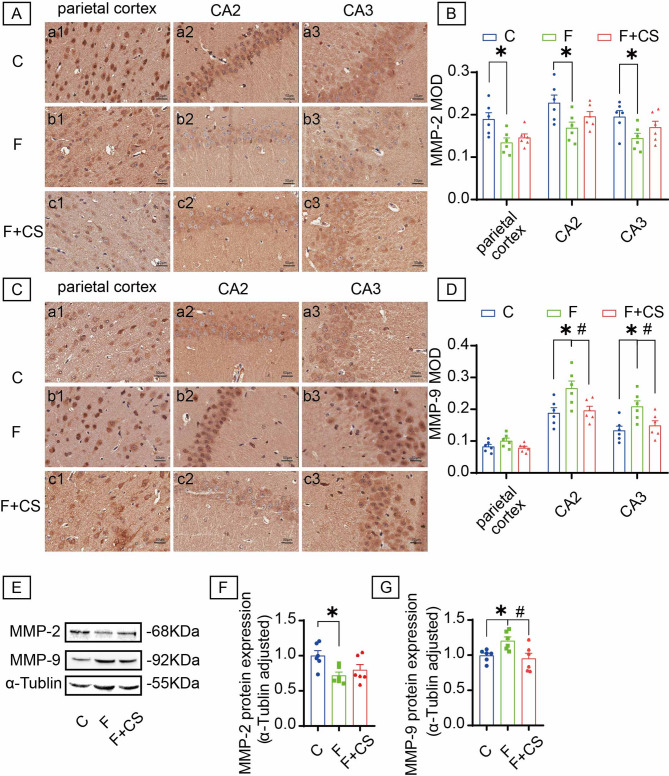
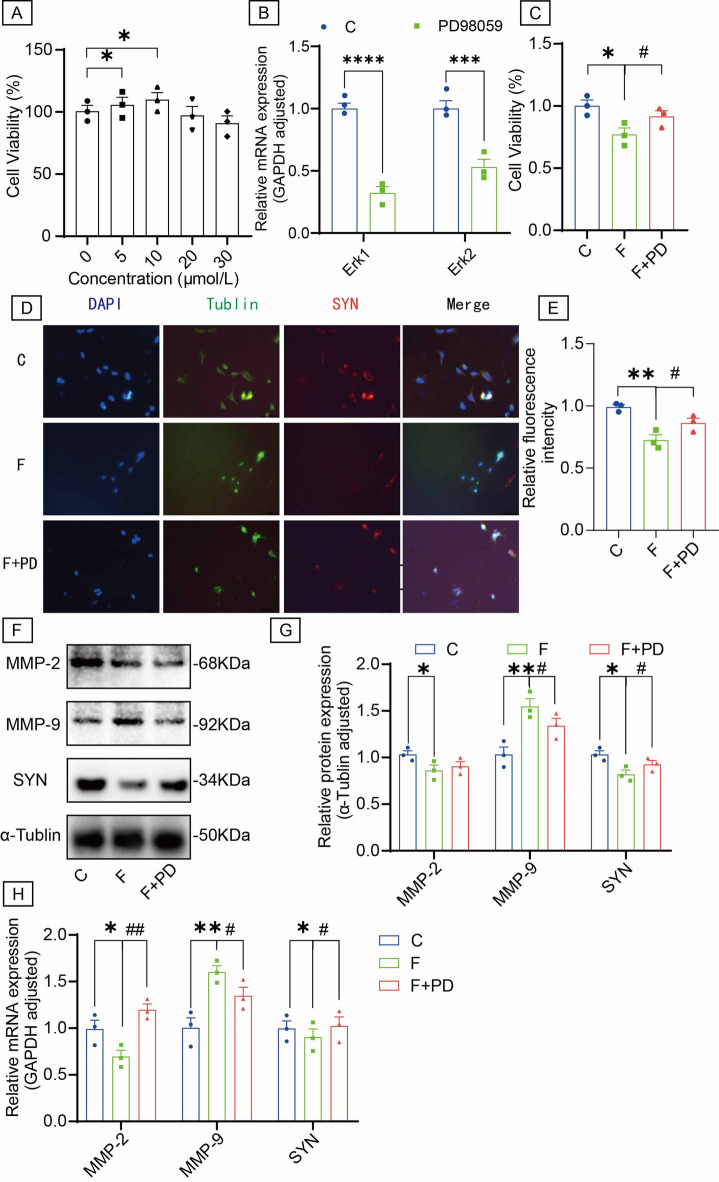
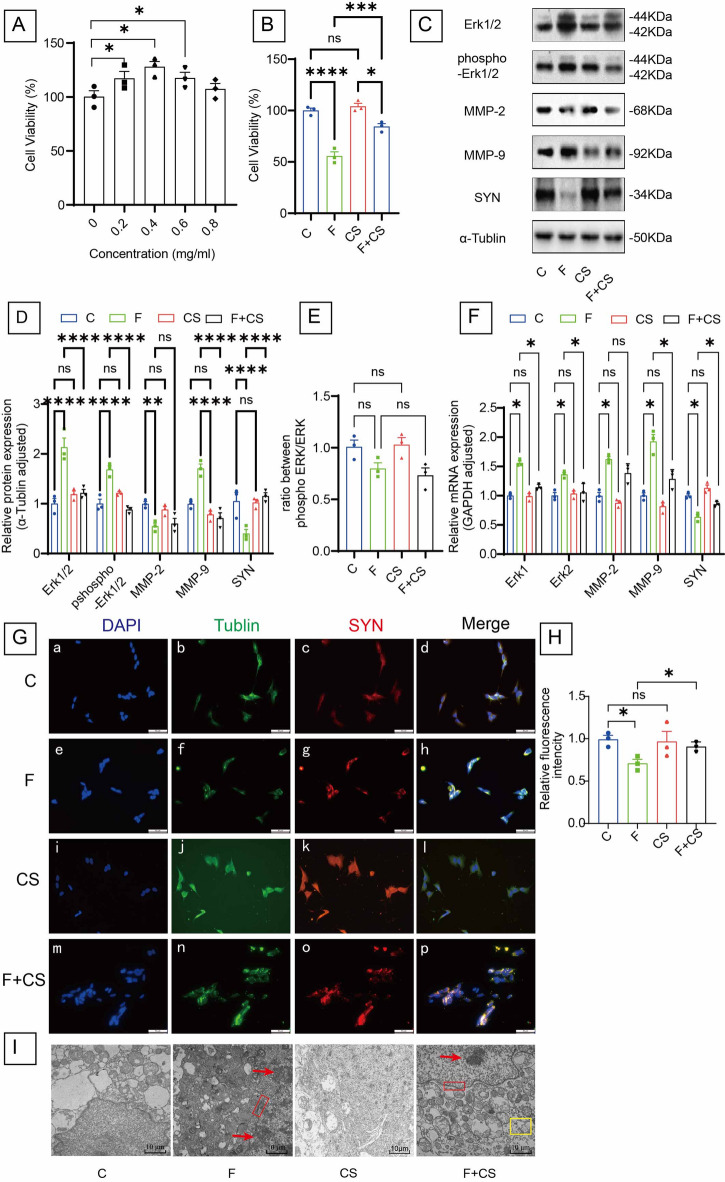
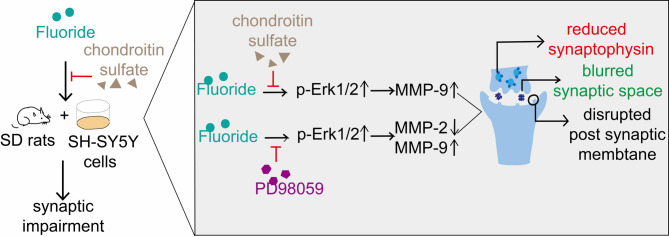
Prolonged exposure to fluoride may induce neurotoxic effects. Chondroitin sulfate (CS) exhibits protective functions within the central nervous system (CNS); however, the mechanism by which CS protects synapses against fluoride remains incompletely understood. Our objective was to investigate the protective efficacy of CS on synapses and decipher its underlying mechanisms. We showed that fluoride exposure reduced the expression of synaptic protein synaptophysin (SYN) and impaired learning and memory functions, whereas CS counteracted these alterations, suggesting its protective effect against fluoride-induced cognitive deficits. Further studies revealed disruption of the Erk1/2/MMP-2/MMP-9 signaling pathway both in vivo and in vitro, manifested by increased total Erk1/2, Erk1/2 phosphorylation and MMP-9 expression, along with decreased MMP-2 levels. Importantly, treatment of SH-SY5Y cells with PD98059 or CS attenuated fluoride-induced effects, indicating a regulatory role of CS in the Erk1/2/MMP-9 signaling pathway. However, MMP-2 was not implicated in this process. These data demonstrate the neuroprotective effects of CS and highlight its potential for protecting against fluoride-induced neurotoxicity and synaptic impairment.

Keywords: Chondroitin sulfate; Erk1/2; Fluoride; MMP-2; MMP-9; SYN.


Conflict of interest statement

Declarations. Competing interests: The authors declare no competing interests. ARRIVE guidelines statement: Our study is reported in accordance with ARRIVE guidelines.

Figures

Fig. 1
Fig. 1
Effects of CS on cognitive (learning and memory), histology and ultrastructure of rats with fluorosis. (A) The escape latency during the place navigation test. Compared with the fluoride group, the escape latency of control group was observed a significant decrease on the third day’ place navigation test. (B) Distance spent in the target quadrant. (C) Time spent in the target quadrant. (D) Number of platform crossings. (E) Tracks of spatial probe test. (F) The pathological morphology of brain tissues was observed by HE staining. The representative images labeled as a1-c1, a2-c2, a3-c3, and a4-c4 correspond to the parietal cortex, CA2 region, CA3 region, and dentate gyrus, respectively. Bar = 50 μm. (G) Ultrastructural observation of the hippocampus. Light blue arrows: Endoplasmic reticulum. Red arrows: Golgi complex. Red box: chromatin condensation and margination. Yellow box: The endocytosis vesicles. Yellow arrows: The structure of synapse. Dark blue arrows: mitochondrion. Bar = 5 μm (top panel), Bar = 500 nm (bottom panel). Data are shown as the mean ± SEM; n = 6–7 for each group. *P < 0.05 and **P < 0.01 with the control group. #P < 0.05 with the Fluorie group.
Fig. 2
Fig. 2
Impact of CS on SYN in various brain regions. (A) The protein expression level of SYN was detected by immunohistochemistry staining. The representative images labeled as a1-c1, a2-c2 and a3-c3 correspond to the parietal cortex, the CA2 region and the CA3 region, respectively. Bar = 50 μm. (B) Mean optical density values of SYN in the parietal cortex, the CA2 region and the CA3 regions. (C) The protein level of SYN was examined using Western blot analysis. The samples derive from the same experiment and that blots were processed in parallel. Original blots are presented in Supplementary Fig. 1. Data are shown as the mean ± SEM; n = 6 for each group. *P < 0.05 with the control group. #P < 0.05 with the Fluorie group.
Fig. 3
Fig. 3
Effects of CS on Erk1/2 and phospho-Erk1/2 in the brain of rats with fluorosis. (A) Immunohistochemistry analysis was utilized to assess the expression levels of phospho-Erk1/2 protein. The representative images labeled as a1-c1, a2-c2, and a3-c3 correspond to the parietal cortex, the CA2 region, and the CA3 region, respectively. Bar = 50 μm. (B) Mean optical density values of phospho-Erk1/2 in the parietal cortex, the CA2 region and the CA3 regions. (C) Representative images of Western blot for Erk1/2 and phospho-Erk1/2 in brain. Quantitative analyses of Erk1/2 (D), phospho-Erk1/2 (E) protein and the ratio of phosphorylated Erk1/2 to total Erk1/2 expression levels (F) normalized to the internal control α-Tublin. The samples derive from the same experiment and that blots were processed in parallel. Original blots are presented in Supplementary Fig. 2. Data are shown as the mean ± SEM; n = 6 for each group. *P < 0.05 with the control group. #P < 0.05 with the Fluorie group. nsP > 0.05 .
Fig. 4
Fig. 4
Effects of CS on MMP-2 and MMP-9 in the brain of rats with fluorosis. The expression levels of MMP-2 protein (A) and MMP-9 protein (C) was detected by immunohistochemistry analysis. The representative samples labeled as a1-c1, a2-c2 and a3-c3 correspond to the parietal cortex, the CA2 region and the CA3 region, respectively. Bar = 50 μm. Mean optical density values of MMP-2 (B) and MMP-9 (D). Representative images of Western blot for MMP-2 protein and MMP-9 protein in brain (E). Quantitative analyses of MMP-2 (F) and MMP-9 (G) protein expression levels normalized to the internal control α-Tublin. The samples derive from the same experiment and that blots were processed in parallel. Original blots are presented in Supplementary Fig. 3. Data are shown as the mean ± SEM; n = 6 for each group. * P < 0.05 with the control group. #P < 0.05 with the Fluorie group.
Fig. 5
Fig. 5
The Erk1/2/MMP-2/MMP-9 signaling pathway inhibition reversed synaptic changes induced by fluoride in SH-SY5Y cells. (A) CCK-8 assay was detected to cell viability of SH-SY5Y cells treated with the different concentrations of PD98059 (0, 5, 10, 20, 30 µmol/L) for 48 h. (B) Quantification of PD98059-mediated suppression of Erk1/2 gene expression by RT-qPCR. (C) The cell viability of SH-SY5Y cells among three groups rats after PD98059 (10 µmol/L) treatment for 48 h. (D) The immunofluorescence staining and (E) quantification analysis of SYN protein in SH-SY5Y cells. (F) The protein levels of MMP-2, MMP-9 and SYN were examined by Western blot in SH-SY5Y cells. (G) Quantitative analyses of MMP-2, MMP-9 and SYN protein expression levels normalized to the internal control α-Tublin. (H) RT-qPCR was used to measure the expression levels MMP-2, MMP-9 and SYN gene in SH-SY5Y cells. The samples derive from the same experiment and that blots were processed in parallel. Original blots are presented in Supplementary Fig. 4. Data are shown as the mean ± SEM; n = 3 for each group. *P < 0.05, **P < 0.01, ***P < 0.001 and ****P < 0.0001 with the control group. #P < 0.05 and ##P < 0.01 with the Fluorie group.
Fig. 6
Fig. 6
CS suppressed synaptic damage induced by fluoride in SH-SY5Y cells. (A) Cell viability of SH-SY5Y cells treated with the CS of different concentrations (0.2, 0.4, 0.6, 0.8 mg/L) for 48 h were detected by CCK-8 assay. (B) CCK-8 was used to examine the cell viability of SH-SY5Y cells after CS (0.4 mg/ml) treatment for 48 h. (C) The Western blot and (D) quantification analysis of Erk1/2, phospho-Erk1/2, MMP-2, MMP-9 and SYN in SH-SY5Y cells. (E) The ratio of phosphorylated Erk1/2 to total Erk1/2 expression levels. (F) RT-qPCR analysis of Erk1/2, MMP-2, MMP-9 and SYN gene in SH-SY5Y cells. (G) The immunofluorescence staining and (H) quantification analysis of SYN in SH-SY5Y cells. (I) Ultrastructural observation of the SH-SY5Y cells. Red arrows: chromatin condensation and margination. Red box: integrity of the nuclear membrane disappeared. Yellow box: The endocytosis vesicles. Bar = 10 μm. The samples derive from the same experiment and that blots were processed in parallel. Original blots are presented in Supplementary Fig. 5. Data are shown as the mean ± SEM; n = 3 for each group. * P < 0.05, ** P < 0.01, *** P < 0.001 and **** P < 0.0001. nsP > 0.05.
Fig. 7
Fig. 7
Diagram depicting the mechanism of CS protected against synaptic impairment caused by fluorosis through the Erk1/2-MMP-9 signaling pathway.

Similar articles

References

    1. Ottappilakkil, H., Babu, S., Balasubramanian, S., Manoharan, S. & Perumal, E. Fluoride induced neurobehavioral impairments in experimental animals: a brief review. Biol. Trace Elem. Res.201 (3), 1214–1236 (2023). - PubMed
    1. Zhao, Q. Y. et al. Effects of neuron autophagy induced by arsenic and fluoride on Spatial learning and memory in offspring rats. Chemosphere308 (Pt 2), 136341 (2022). - PubMed
    1. Zhao, Y. F., Zhao, X. J. & Wang, J. D. Choline alleviated perinatal fluoride exposure-induced learning and memory impairment through α4β2 nAChRs and α7 nAChRs in offspring mice. Environ. Toxicol.38 (3), 511–521 (2023). - PubMed
    1. Bartos, M. et al. Rat developmental fluoride exposure affects retention memory, leads to a depressive-like behavior, and induces biochemical changes in offspring rat brains. Neurotoxicology93, 222–232 (2022). - PubMed
    1. Ren, C., Li, H. H., Zhang, C. Y. & Song, X. C. Effects of chronic fluorosis on the brain. Ecotoxicol. Environ. Saf.244, 114021 (2022). - PubMed

LinkOut - more resources