. 2025 Aug 13;10(1):258.
doi: 10.1038/s41392-025-02339-z.

Single-cell RNA sequencing identifies the prolactin receptor as a therapeutic target in adenomyosis

Affiliations

Single-cell RNA sequencing identifies the prolactin receptor as a therapeutic target in adenomyosis

Runze Wang et al. Signal Transduct Target Ther. .

Abstract

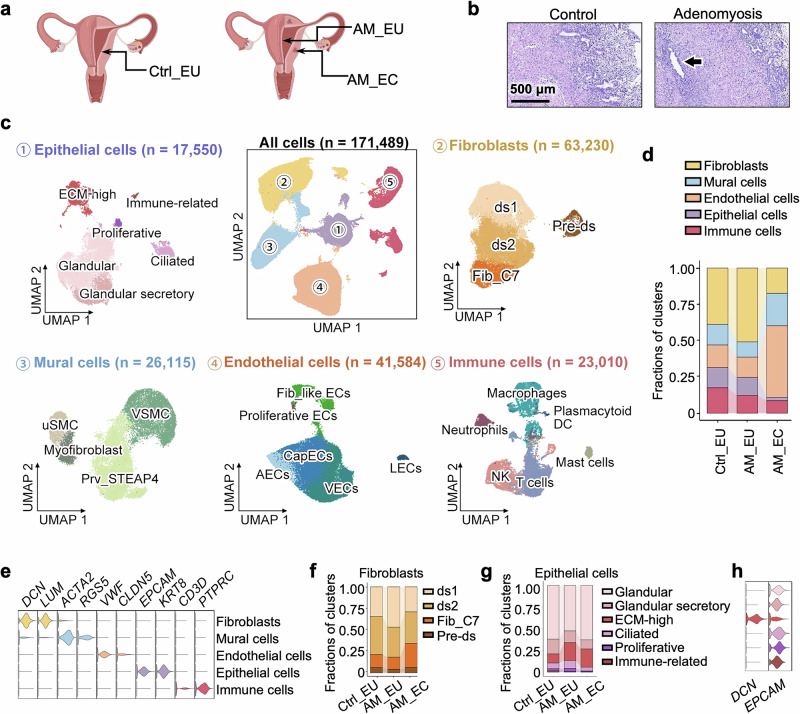
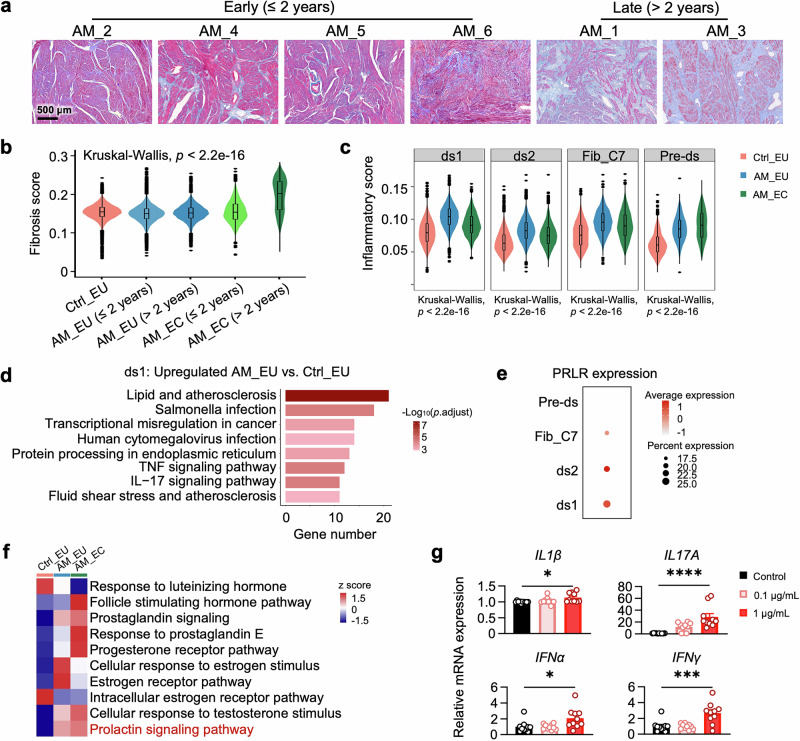
Adenomyosis is a complex gynecological disease characterized by endometrial tissue invasion into the myometrium. Current interventions, such as hormonal therapy or hysterectomy, are associated with significant side effects and compromise fertility, underscoring the urgent need for safe and effective treatments. Using single-cell RNA sequencing (scRNA-seq) of uterine samples from patients, we identified prolactin (PRL) signaling as a key pathological driver of adenomyosis. Specifically, scRNA-seq revealed a distinct epithelial subcluster with enriched PRL receptor (PRLR) expression. PRL signaling is overactivated in this epithelial subcluster, promoting cellular survival and proliferation, which contributes to lesion formation and expansion in adenomyosis. Concurrently, PRLR is also highly expressed in a fibroblast subcluster characterized by strong expression of inflammation-related genes. Pathological PRL hyperactivation was further validated in preclinical animal models, where transgenic overexpression of PRL or pituitary transplantation induced an adenomyosis phenotype. Importantly, we demonstrated that dysregulation of local PRL signaling led to the development and progression of adenomyosis, whereas inhibition of PRLR with the monoclonal antibody HMI-115 markedly ameliorated pathological manifestations. These findings establish PRL signaling as a critical driver of adenomyosis pathogenesis, highlighting PRLR inhibition as a promising therapeutic strategy and demonstrating the translational potential of HMI-115 for treating adenomyosis, a gynecological condition that has long been neglected in drug development.


Conflict of interest statement

Competing interests: The authors declare no competing interests.

Figures

Fig. 1
Fig. 1
Identification of ECM-high epithelial cells in the endometrium. a Diagram showing the locations of uterine biopsies collected for scRNA-seq, including eutopic endometria from individuals without adenomyosis (Ctrl_EU) and eutopic (AM_EU) and ectopic (AM_EC) endometrial tissues from patients with adenomyosis. b Representative images of hematoxylin and eosin (H&E) staining of endometria from participants without (Control) or with (Adenomyotic) adenomyosis. The arrow indicates the ectopic endometrial gland. Scale bar, 500 μm. c Uniform manifold approximation and projection (UMAP) plot showing 171,489 single cells from eutopic and ectopic endometrial tissue samples (center UMAP plot), which were grouped into 5 cell types: epithelial cells, fibroblasts, mural cells, endothelial cells, and immune cells. Each cell type was further clustered into subpopulations, as shown in the radial UMAP plots. d Bar plot showing the fractions of major cell types among all the cells in different sample groups of Ctrl_EU, AM_EU, and AM_EC. e Violin plot showing the expression of the marker genes used for identifying the major cell types in this scRNA-seq dataset. f Bar plot showing the fractions of fibroblast subclusters in different sample groups. g Bar plot showing the fractions of epithelial subclusters in different sample groups. h Violin plot showing that ECM-high epithelial cells expressed both EPCAM and DCN
Fig. 2
Fig. 2
Pathological changes in ECM-high epithelial cells in adenomyosis. a Slingshot analysis showing the trajectory of the differentiation of epithelial cells with ECM-high epithelial cells as the shared starting cluster for 3 different lineages. b The relative development order of each epithelial subtype determined by CytoTRACE 2. c Bar plot showing the fractions of epithelial cell subclusters in the endometria of control individuals (Ctrl_EU) and eutopic (AM_EU) or ectopic (AM_EC) endometrial tissue of patients with a history of adenomyosis less than or equal to 2 years (≤ 2 years) or longer than 2 years (> 2 years). d Hierarchical clustering of epithelial and fibroblast subclusters. The ECM-high epithelial cells from adenomyosis patients (ECM-high_AM_EU) were further grouped according to the duration of the condition, with a history of less than or equal to 2 years designated ≤ 2 years and more than 2 years designated > 2 years. e Dot plot showing the Z-score-scaled mean expression of EMT-related genes, as well as epithelial and fibroblast marker genes, in ECM-high epithelial cells from the eutopic endometria of control (Ctrl_EU) and adenomyosis patients (AM_EU) with a disease history of less than or equal to 2 years or longer than 2 years. f Heatmap showing the results of gene set variation analysis (GSVA) of hormone-related pathways in subclusters of epithelial cells. g Heatmap showing the results of GSVA of hormone-related pathways in ECM-high epithelial cells from Ctrl_EU, AM_EU, and AM_EC. h Density plot showing the expression levels of PRLR in epithelial cells
Fig. 3
Fig. 3
PRL signaling promotes proliferation and represses apoptosis of epithelial cells. a, b Representative images (a) and statistical results of the signal intensity (b) of the immunohistochemical staining of PRLR in human uterine sections. Scale bar, 100 μm. (Ctrl_EU, n = 7; AM_EU, n = 6; AM_EC, n = 6). c PRL levels in the sera of individuals with (AM) or without (Ctrl) adenomyosis. (Ctrl, n = 23; AM, n = 27) d Representative images of RNAscope results showing the expression of EPCAM, DCN, and PRLR in the eutopic endometrium (Ctrl_EU) and myometrium (Ctrl_MM) of control individuals as well as in the eutopic endometrium (AM_EU) and lesions in the myometrium (AM_MM) of adenomyosis patients. Scale bars, 50 μm in the panels of columns 1–5 and 500 μm in the last column. e Numbers of primary human endometrial epithelial cells treated with PRL at the indicated concentrations. (n = 8 for each group). f Statistical results of the luminescence assay measuring caspase-3 and -7 activities in primary human endometrial epithelial cells treated with doxorubicin in the presence or absence of PRL at the indicated concentrations. (n = 6 for each group). g Box and violin plots displaying the apoptosis scores of epithelial cells in the Ctrl_EU, AM_EU, and AM_EC groups. The upper and lower quartiles are indicated, with horizontal lines representing the median. The whiskers extend to the range of data within 1.5 times the interquartile range above the third quartile and below the first quartile. The sample sizes were as follows: Ctrl_EU: n = 9618; AM_EU: n = 6908; and AM_EC: n = 1024. h, i Representative images (h) and statistical results of the signal intensity (i) of TUNEL staining of the eutopic endometrium (AM_EU) and the corresponding lesions in the myometrium (AM_EC) from the same patient. Scale bar, 200 μm. (n = 6 for each group) All the data are presented as the means ± s.e.m.s. P-values were determined via one-way ANOVA with Tukey’s multiple comparison (b, e, and f), a two-sided unpaired t-test (c), a Kruskal‒Wallis test followed by Dunn’s test with Bonferroni correction (g), or a two-tailed paired Wilcoxon matched-pair test (i). *P < 0.05; **P < 0.01; ****P < 0.0001 compared with the corresponding controls
Fig. 4
Fig. 4
The fibroblast subcluster ds1 was enriched in the expression of inflammatory genes and augmented PRL signaling in adenomyosis. a Representative images of Masson’s trichrome staining of uterine sections from patients diagnosed with adenomyosis for less than or equal to 2 years (≤ 2 years) or more than 2 years (> 2 years). Scale bar, 500 μm. b Box and violin plots displaying the fibrosis scores of fibroblasts in the Ctrl_EU, AM_EU (≤ 2 years), AM_EU (> 2 years), AM_EC (≤ 2 years), and AM_EC (> 2 years) groups. The sample sizes were as follows: Ctrl_EU: n = 26,812; AM_EU (≤ 2 years): n = 19,362; AM_EU (> 2 years): n = 8922; AM_EC (≤ 2 years): n = 6744; and AM_EC (> 2 years): n = 1390. c Box and violin plots displaying the inflammatory scores across different fibroblast clusters. The sample sizes were as follows: Ctrl_EU (ds1: n = 9289; ds2: n = 11,800; Fib_C7: n = 4135; Preds: n = 1588), AM_EU (ds1: n = 13,260; ds2: n = 9875; Fib_C7: n = 4003; Pre-ds: n = 1146), and AM_EC (ds1: n = 2375; ds2: n = 2994; Fib_C7: n = 2265; Preds: n = 500). In the box plots of (b) and (c), the upper and lower quartiles are indicated, with horizontal lines representing the median. The whiskers extend to the range of data within 1.5 times the interquartile range above the third quartile and below the first quartile. d Bar plot showing the activated pathways enriched by Kyoto Encyclopedia of Genes and Genomes (KEGG) analysis of the upregulated genes in the ds1 cells of eutopic endometria from adenomyosis patients (AM_EU) compared with those from control subjects (Ctrl_EU). e Dot plot showing the Z-score-scaled mean expression of PRLR in each fibroblast subcluster. f Heatmap showing the results of GSVA of hormone-related pathways in ds1 cells. g Relative mRNA levels of inflammatory cytokines in hEM15A cells treated with vehicle (Control) or PRL at the indicated concentrations, as determined by RT‒qPCR. (n = 10 for each group). Statistical differences were assessed via the Kruskal‒Wallis test followed by Dunn’s test with Bonferroni correction in (b, c) or one-way ANOVA with Dunnett’s multiple comparisons test in (g). *P < 0.05; ***P < 0.001; ****P < 0.0001 compared with the corresponding controls
Fig. 5
Fig. 5
High levels of PRL trigger, while blocking the PRLR alleviates adenomyosis in animal models. a Serum PRL levels in PRL transgenic (PRL-TG) mice and their wild-type (WT) littermates. (n = 7 for each group). b Representative images of H&E-stained uteri from WT and PRL-TG mice. The arrows indicate the ectopic endometrial glands. Scale bar, 250 μm. c Adenomyosis scores of mice at the indicated ages. (2–8 months, n = 3 for each genotype; 12 months, WT = 5; PRL-TG, n = 7). d, f Experimental design of early treatment (d), representative images of H&E-stained uteri (e), and adenomyosis scores (f) of mice subjected to sham surgery (Sham) or uterine horn pituitary transplantation (UPT) and treated with saline (No treatment), IgG, or HMI-115. The arrows indicate the ectopic endometrial glands. Scale bar, 500 μm. (Sham, n = 10; No treatment, n = 11; IgG or HMI-115, n = 10). g–i Experimental design of late treatment (g), representative images of H&E-stained uteri (h), and adenomyosis scores (i) of mice subjected to sham surgery (Sham) or UPT and treated with saline (No treatment), IgG, or HMI-115. The arrows indicate the ectopic endometrial glands. Scale bar, 500 μm. (Sham, n = 22; No treatment, n = 14; IgG, n = 19; HMI-115, n = 19). All the data are presented as the means ± s.e.m.s. P-values were determined via two-tailed unpaired t-tests (a), multiple Mann‒Whitney tests (c), or one-way ANOVA with Dunn’s multiple comparisons (f, i). *P < 0.05; **P < 0.01; ***P < 0.001; ****P < 0.0001 compared with the corresponding controls

References

    1. Bird, C. C., McElin, T. W. & Manalo-Estrella, P. The elusive adenomyosis of the uterus-revisited. Am. Jobstet. Gynecol.112, 583–593 (1972). - PubMed
    1. Antero, M. F., Ayhan, A., Segars, J. & Shih, I. M. Pathology and pathogenesis of adenomyosis. Semin. Reprod. Med.38, 108–118 (2020). - PMC - PubMed
    1. Gordts, S., Grimbizis, G. & Campo, R. Symptoms and classification of uterine adenomyosis, including the place of hysteroscopy in diagnosis. Fertil. Steril.109, 380–388.e381 (2018). - PubMed
    1. Levgur, M., Abadi, M. A. & Tucker, A. Adenomyosis: symptoms, histology, and pregnancy terminations. Obstet. Gynecol.95, 688–691 (2000). - PubMed
    1. Chapron, C. et al. Diagnosing adenomyosis: an integrated clinical and imaging approach. Hum. Reprod. Update26, 392–411 (2020). - PubMed

LinkOut - more resources