

Telomere-to-telomere genome assembly uncovers Wolbachia-driven recurrent male bottleneck effect and selection in a sawfly
- PMID: 40804293
- PMCID: PMC12350658
- DOI: 10.1038/s42003-025-08629-0
Telomere-to-telomere genome assembly uncovers Wolbachia-driven recurrent male bottleneck effect and selection in a sawfly
Abstract
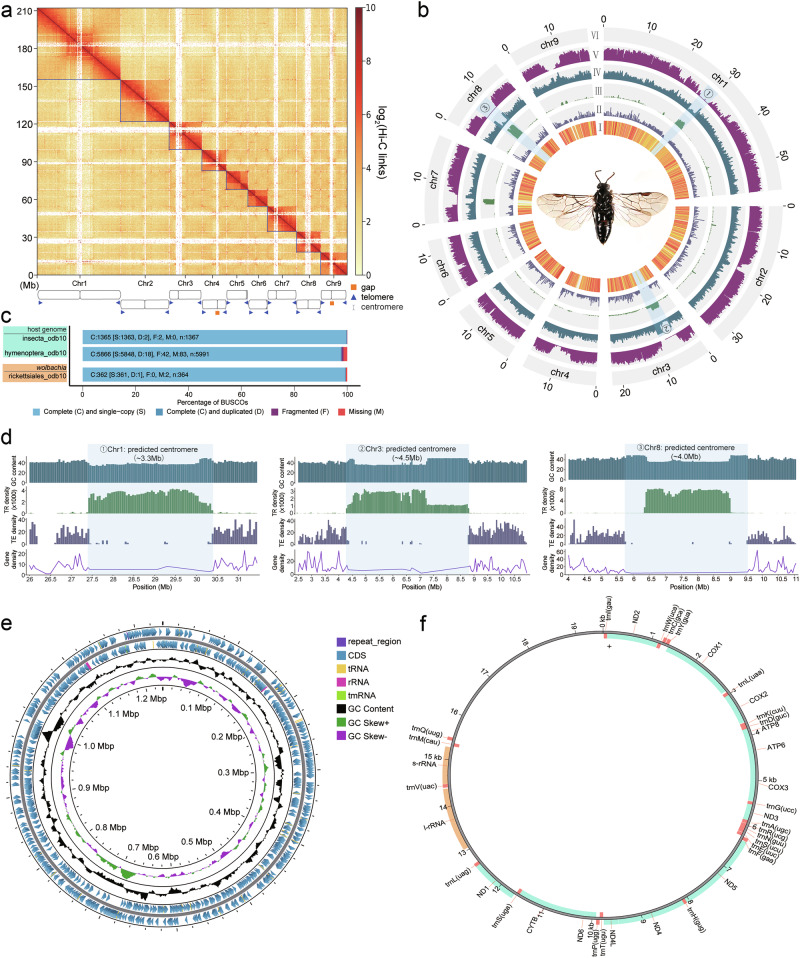
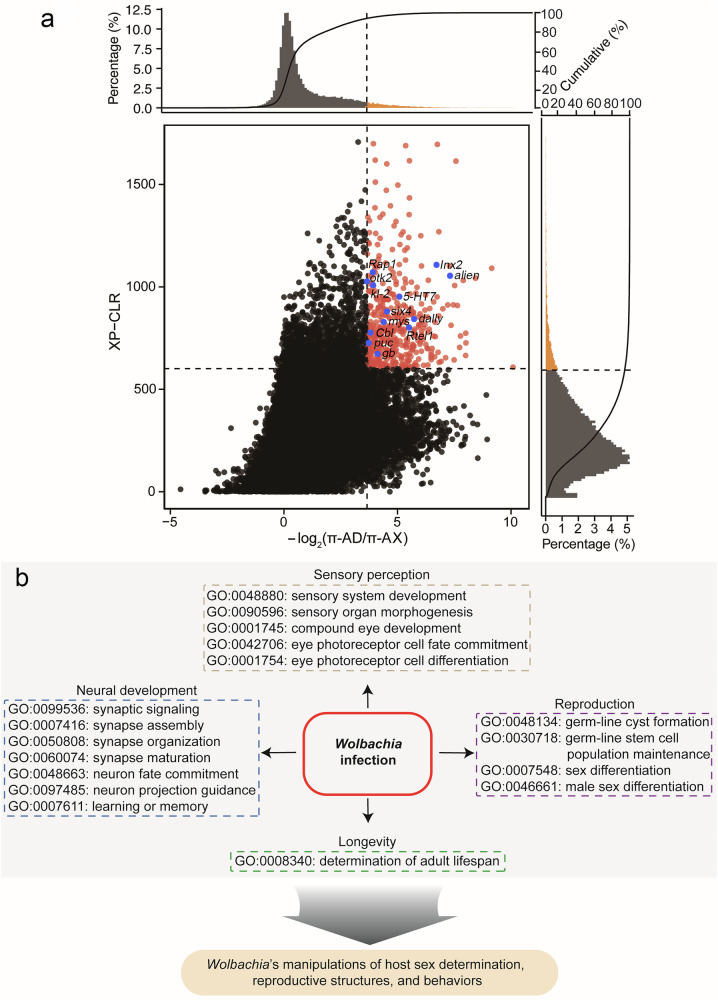
Wolbachia, a widespread endosymbiotic bacterium, profoundly impacts insect hosts by distorting reproduction and population dynamics. Despite extensive laboratory research, its long-term effects on host evolution in nature remain poorly understood, especially the genomic consequences linked to disruptions in sex determination and reproductive processes. We present the first telomere-to-telomere (T2T) genome assembly of the sawfly Analcellicampa danfengensis and the complete genome of its symbiotic Wolbachia. Comparative population genomics across six Analcellicampa species revealed that Wolbachia-infected populations show starkly different demographic signals. While uninfected populations show similar demographic signals for both sexes, infected populations exhibit a lower apparent effective population size (Ne) in males, which may reflect a recurrent male bottleneck effect driven by Wolbachia-induced male scarcity. Genomic scans identified positively selected genes associated with reproductive functions, sensory perception, neural development, and longevity, suggesting that Wolbachia likely manipulates critical host pathways to promote its transmission. These findings provide direct genomic insights into Wolbachia as an evolutionary force, highlighting specific host genes and regions under selection resulting from these altered evolutionary dynamics. This work provides deeper insights into host-endosymbiont coevolution and has important implications for evolutionary theory and pest management strategies.
© 2025. The Author(s).
Conflict of interest statement
Competing interests: The authors declare no competing interests. Ethics: All procedures involving animals were based on the care and use guidelines of experimental animals established by the Ministry of Science and Technology of China. We have complied with all relevant ethical regulations for animal use.
Figures
Similar articles
-
Prescription of Controlled Substances: Benefits and Risks.2025 Jul 6. In: StatPearls [Internet]. Treasure Island (FL): StatPearls Publishing; 2025 Jan–. 2025 Jul 6. In: StatPearls [Internet]. Treasure Island (FL): StatPearls Publishing; 2025 Jan–. PMID: 30726003 Free Books & Documents.
-
Nucleotide composition shapes gene expression in Wolbachia pipientis: a role for MidA methyltransferase?mSystems. 2025 Aug 15:e0077925. doi: 10.1128/msystems.00779-25. Online ahead of print. mSystems. 2025. PMID: 40815476
-
Population incompatibility associated with Wolbachia in the Asian citrus psyllids, Diaphorina citri: insights for pest management.Pest Manag Sci. 2025 Jul 10. doi: 10.1002/ps.8914. Online ahead of print. Pest Manag Sci. 2025. PMID: 40635644
-
Wolbachia-carrying Aedes mosquitoes for preventing dengue infection.Cochrane Database Syst Rev. 2024 Apr 10;4(4):CD015636. doi: 10.1002/14651858.CD015636.pub2. Cochrane Database Syst Rev. 2024. PMID: 38597256 Free PMC article.
-
Fabricating mice and dementia: opening up relations in multi-species research.In: Jenkins N, Jack-Waugh A, Ritchie L, editors. Multi-Species Dementia Studies. Bristol (UK): Bristol University Press; 2025 Feb 25. Chapter 2. In: Jenkins N, Jack-Waugh A, Ritchie L, editors. Multi-Species Dementia Studies. Bristol (UK): Bristol University Press; 2025 Feb 25. Chapter 2. PMID: 40690569 Free Books & Documents. Review.
References
-
- Moreira, L. A. et al. A Wolbachia symbiont in Aedes aegypti limits infection with dengue, Chikungunya, and Plasmodium. Cell139, 1268–1278 (2009). - PubMed
-
- Klepzig, K., Adams, A., Handelsman, J. & Raffa, K. Symbioses: a key driver of insect physiological processes, ecological interactions, evolutionary diversification, and impacts on humans. Environ. Entomol.38, 67–77 (2009). - PubMed
-
- Porter, S. S. & Sachs, J. L. Agriculture and the disruption of plant–microbial symbiosis. Trends Ecol. Evol.35, 426–439 (2020). - PubMed
-
- Brucker, R. M. & Bordenstein, S. R. Speciation by symbiosis. Trends Ecol. Evol.27, 443–451 (2012). - PubMed
-
- Weeks, A. R., Reynolds, K. T. & Hoffmann, A. A. Wolbachia dynamics and host effects: what has (and has not) been demonstrated?. Trends Ecol. Evol.17, 257–262 (2002).
Grants and funding
LinkOut - more resources
Full Text Sources
