. 2025 Aug 13;16(1):7507.
doi: 10.1038/s41467-025-62921-5.

Microtubule mechanotransduction refines cytomegalovirus interactions with and remodeling of host chromatin

Affiliations

Microtubule mechanotransduction refines cytomegalovirus interactions with and remodeling of host chromatin

Celeste D Rosencrance et al. Nat Commun. .

Abstract

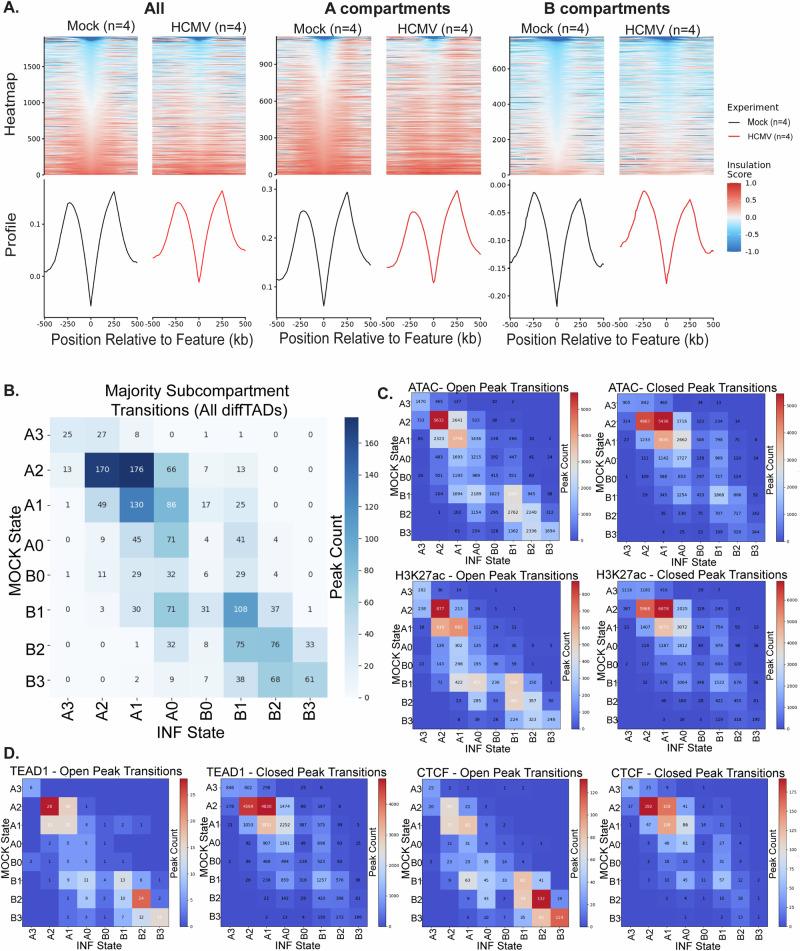
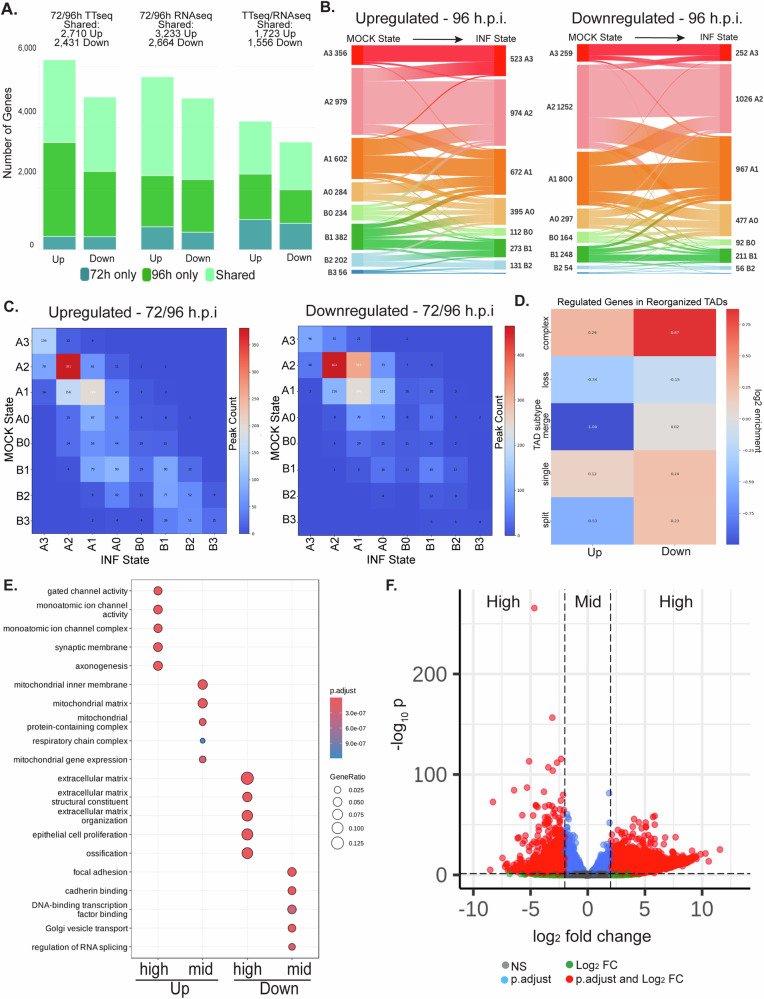
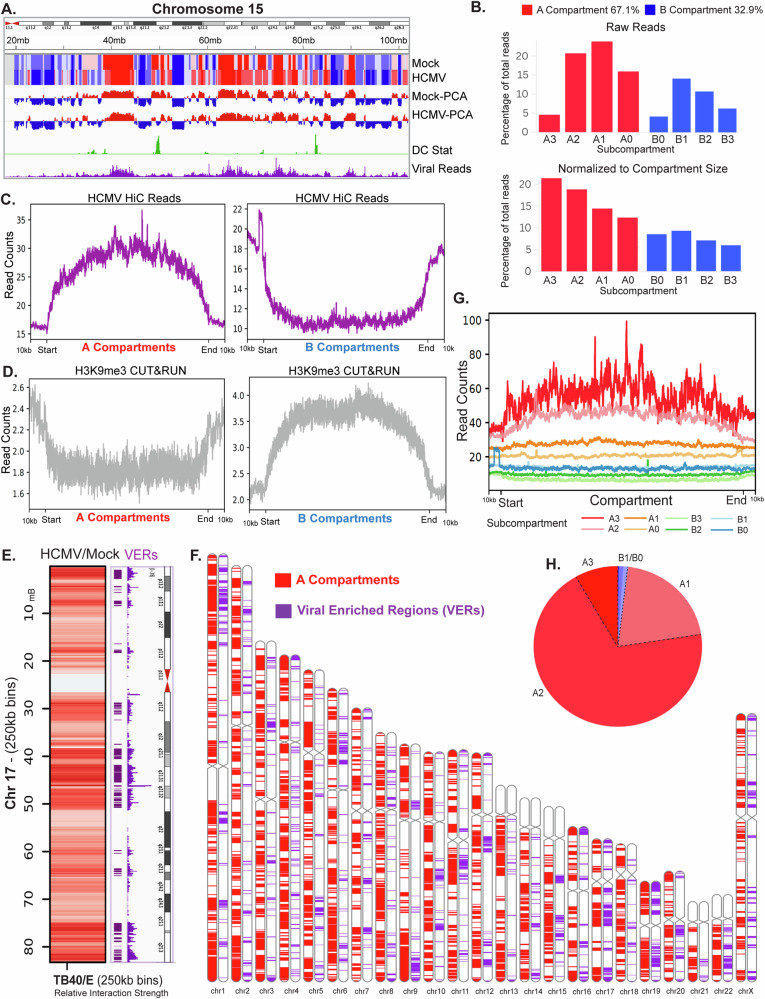
Human cytomegalovirus extensively alters nuclear organization and the cellular transcriptome, yet understanding of these genome-wide events remains relatively limited. Here, chromatin conformation capture (Hi-C) revealed how cytomegalovirus alters chromosome organization at both large- and small-scales. Nascent transcriptomics further revealed how transcriptional changes correlate with genomic reorganization, while also uncovering infection-induced transcriptional dysregulation that contributes to the induction of neuronal gene signatures in infected fibroblasts. Combining Hi-C and Cleavage Under Targets & Release Using Nuclease (CUT&RUN) we find that viral genomes preferentially localize to highly euchromatic compartments, further dysregulating transcription of host genes. Finally, RNAi-mediated depletion of two key effectors of microtubule-based forces that are exerted on the nucleus provides insights into their diverging roles in regulating compartment-scale contacts and viral genomic interactions with host chromatin. Combined, we reveal the extent to which HCMV interacts with and alters host chromatin and transcription, and the influence of microtubule mechanotransduction on these processes.


Conflict of interest statement

Competing interests: The authors declare no competing interests.

Figures

Fig. 1
Fig. 1. HCMV remodels host chromatin contacts and compartment organization.
NHDFs were mock-infected or infected with HCMV (MOI 5) for the indicated times. A Genome-wide changes in chromatin interactions displayed by dividing Hi-C matrices for mock versus infected cells at 72.h.p.i. TB40/E genome added as an extra chromosome. HiGlass resolution = 5.12 Mb. Division = ratio of normalized contact frequencies. n = 2 per sample. B Intrachromosomal contact alterations shown by division comparison of combined Hi-C datasets from 72/96 h.p.i. for infected samples and 72/120 h for mock conditions. Juicebox resolution = 500 kb. Normalization = Balanced. Division = log[Observed/Control*(AvgC/OvgO)]. Scale = − 9 to 9 log enrichment. n = 4 per sample. C Pearson correlation matrices and corresponding eigenvectors (PC1) of Chr 2 between mock and infected combined datasets reveal large-scale cis-chromosomal reorganization. Juicebox resolution = 500 kb. Scale = − 1 to + 1. n = 4 per condition. D Saddle plots illustrating compartment interaction frequencies. Infection affects global compartmentalization, as contacts between A compartments or between B compartments decrease while interactions between A and B compartments increase. Difference saddle plot (lower right); green colors in A-A or B-B corners indicate loss of interactions and gain of A-B interactions shown as pink. GENOVA resolution = 100 kb. Bins = 20. n = 4 per condition. E, F. Chromosomal compartment level changes in (E). were identified by dcHiC for Chr 17, displayed with IGV, performed at 100 kb resolution. Top rows, dcHiC subcompartment segmentations set to default calls = 6. Red = A compartments. Blue = B compartments. Resolution = 100 kb. Middle rows, dcHiC PCA tracks. Bottom row (green), Log2Pvalue of differential compartments called by dcHiC (DC stat). Zooms in F. show examples of compartment changes and spreading. G Alluvial diagram showing starting subcompartment state in mock and end state in infection, using 100 kb binned subcompartments (not merged, unlike Bedtools approaches in S3C-D). Note that in each case, compartment numbers refer to the total number before or after infection, while the thickness of lines traces starting compartments to their final compartment state after infection. Generated with Flourish, and an interactive version is available at https://public.flourish.studio/visualisation/21041814/.
Fig. 2
Fig. 2. Local contact alterations and features occur within changing and stable compartments during infection.
Topologically associating domain (TAD) insulation and reorganization was assessed globally and locally, while TAD changes and other chromatin features associated with different subcompartments. A Global TAD insulation (left) is reduced during infection, both in A and B compartments (right). B Subcompartment transition state localization of reorganized TADs identified with diffDomain at 10 kb, comparing dcHiC compartment calls in original mock and final infected states. C, D Subcompartment transition state localizations were assigned for open (gained on infection) or closed (lost on infection) peaks sourced from Sayeed et al. for various chromatin features; accessibility (ATACseq), transcriptional activity (H3K27ac), transcription factor binding (TEAD1), and boundary elements (CTCF), comparing dcHiC compartment calls in original mock and final infected states.
Fig. 3
Fig. 3. HCMV extensively reprograms host nascent and steady state transcriptomes.
Mock or infected samples taken at 72 h.p.i. (n = 2) or 96 h.p.i. (n = 4) were pulsed with 4sU and nascent RNA was isolated for TTseq, or total RNA was sequenced (RNAseq). A Comparisons of DE genes identified at the indicated timepoints showing shared and unique genes in TTseq, RNAseq and across both TTseq and RNAseq datasets. The number of shared genes at both times is indicated for each condition. B, C Compartment distributions of DE genes. Genes were assigned to 100 kb binned subcompartment calls, requiring an overlap of 75% of the gene. Alluvial diagram of DE genes showing start (mock) and end (inf) compartment state for up-regulated or down-regulated genes at 96 h.p.i. is shown in B. Interactive version is available at https://public.flourish.studio/visualisation/20359025/. Compartment transition states of core 72/96 h.p.i. DE genes are shown in (C). D diffDomain was used to identify several types of TAD reorganization upon infection (split, single, merge, loss and complex subtypes) and enrichment in each subtype of up- or down-regulated genes identified by DEseq2. See also Supplementary Fig. 5. E, F DEseq2 was used to identify differentially expressed genes between mock and infected samples at 96 h.p.i. n = 4 per condition. Differentially expressed genes were subdivided by Log2FC below (mid) or above 2 (high) (Log2FC > 2 & < − 2). E Gene Ontology analysis of statistically significant upregulated or downregulated genes at 96 h.p.i., plotted using clusterProfiler. F EnhancedVolcano plot displaying mid versus high (Log2FC > 2 & < − 2) expression changes.
Fig. 4
Fig. 4. HCMV causes transcriptional dysregulation.
A, B Averaged read coverage within and nearby gene bodies for upregulated or downregulated genes between mock and infected conditions, plotted for nascent RNA (TTseq) (A) or total RNA levels (RNAseq) (B). Read counts for “all genes” is also plotted, highlighting the effects of infection on gene expression overall versus up- or down-regulated genes. Data were normalized and replicates combined using Deeptools before display with plotProfile. Region body length = 100 kb. Bin size = 10. CF ARTDeco was used to characterize read-in (RI) and read-through (RT) in mock versus infected TTseq and RNAseq samples described in A-B above. Rates of RI or RT for the top 1000 expressed genes (C) in individual 72 (n = 2) and 96 (n = 4) h datasets, as well as averaged datasets for effects of infection over both timepoints (dark green, n = 6). Transcriptional profile (D) of upregulated gene categories, high (logFC > 2), mid (0;< logFC > 2), and read-in (log2FC > 2, read-in rate > − 2). E Subcompartment transition state localization of read-in genes shows affected gene flow from the original mock to the final infected states. F Examples of read-in genes visualized in IGV; PLAC8L1 is found in an A compartment that is altered by infection, and C3orf20 is in a weak B (white box) that becomes A upon infection. Both are accompanied by TAD changes during infection. Shown in each are compartments in uninfected and infected cells determined by dcHiC together with DC stats and viral reads (n = 4), H3K4me3 (promoter, n = 2) and H3K9me3 (repressive mark, n = 2) CUT&RUN tracks, average read counts from TTseq at 72 (n = 2) or 96 h (n = 4), up- or down-regulated genes called by DEseq2 (green and orange, respectively), genes upregulated by read-in as identified by ARTDeco (light green) and 20 kb TADs in mock (blue) or infected (purple) cells identified using HiCExplorer.
Fig. 5
Fig. 5. HCMV genomes accumulate at euchromatic regions of the host genome.
Viral-host interactions were extracted using HiCPro’s makeviewpoints from combined 72 and 96 h (n = 4) infected HiC datasets to identify regions of enrichment. A Viral-host contacts visualized with dcHiC compartment analysis shows overlap with A compartments using Chromosome 15 as an example. B Viral genome interactions across subcompartments. Top; percent of viral-host reads mapped to subcompartments. Bottom; subcompartments were normalized by size and viral genome coverage. C, D. Enrichment of viral reads in (A) compartments and de-enrichment in (B) compartments (C) is evident in the aggregated signal profile controlling for compartment size. H3K9me3 (repressive mark) CUT&RUN performed on mock-infected or infected NHDFs at 96 h.p.i. (MOI 5, n = 2 per sample) shows the opposing depletion of H3K9me3 reads in A compartments and enrichment in (B) compartments (D). EH Identification of viral interaction hotspots (VERs) and their interactions with the host genome. E GENOVA-derived heatmaps of trans contacts highlight viral-host reads across Chromosome 17. Parameters = znorm. Mode = difference. The top 10% of 100 kb bins of the host genome most enriched for viral reads, termed VERs, are highlighted in purple on the accompanying chromosome map with viral read plots on the right. F Distribution of A compartments and VERs across all chromosomes displayed with an Ideogram. GDeeptools plotProfile of VERs across subcompartments. Region body length = 100 kb. Bin size = 10. H Percent of Viral Enriched Regions (VERs) within each subcompartment.
Fig. 6
Fig. 6. Microtubule forces alter virus-host genomic interactions and effects on host chromatin compartments.
A, B Mock or HCMV-infected (MOI 5) NHDFs were treated with control non-targeting siRNAs or siRNAs targeting SUN1 or ATAT1. Samples were harvested at 96 h.p.i. and then processed for HiC. n = 3 independent experiments. A GENOVA-derived heatmaps of trans contacts highlight viral-host reads across Chromosomes 17 and 19, as examples. Shown are mock versus infected (left) alongside mock versus control siRNA (siC)-treated infected samples or infected samples treated with control siRNA versus ATAT1 or SUN1 siRNAs. Parameters = znorm. Mode = difference. VERs are highlighted in purple on chromosome maps with viral read plots on the right. Note that VERs distributions are altered, and many normally weak viral contacts become stronger, resulting in blue colors in subtraction plots of infected control versus ATAT1 knockdown samples. A more broadly mixed phenotype is seen for SUN1 depletion. B Differences in local A-A, B-B or A-B contacts visualized using saddle plots, with A-A and B-B contacts decreasing during infection. Depletion of SUN1 or ATAT1 results in stronger A-A contacts and weaker B-B contacts in infected cells compared to control conditions. GENOVA resolution = 100 kb. Bins = 25. C HCMV-infected NHDFs were treated with either of two independent control non-targeting siRNAs or siRNAs targeting SUN1 or ATAT1. Samples were pulsed with 4sU and then harvested at 72 h.p.i. (n = 2) or 96 h.p.i. (n = 4) for TTSeq. Volcano plots illustrate the effects of target depletion on host gene expression compared to control siRNA-treated infected cells identified using DESeq. Adjusted p-value cutoff = 0.05, Log2FC cutoff = 0. D Ideograms displaying the chromosome locations of Viral Enriched Regions (VERs) and significantly affected ATAT1 and SUN1 knockdown-sensitive genes identified in TTseq datasets at 96 h.p.i. n = 4 per condition.
Fig. 7
Fig. 7. Model of the role of microtubule mechanotransduction in host and viral genome organization during HCMV infection.
A Under normal infection conditions, acetylated microtubules not only serve to pull heterochromatic B compartments, but also euchromatic A compartments towards the viral Assembly Compartment (AC) to maximize their separation from partially phase-separated viral replication compartments (RCs). This results in interactions between viral genomes and specific, nearby euchromatic regions of the host genome. These pulling forces, effects of infection and the presence of expanding RCs result in increased A-B compartment interactions. B Loss of tubulin acetylation and microtubule-based mechanotransduction results in reduced heterochromatic B-B interactions and increased euchromatic A-A interactions, along with greater intermingling of RCs with host euchromatin. In the case of SUN1, its loss results in even greater intermingling due to its dual roles in mechanotransduction and direct control of genome organization. Created in BioRender. Rosencrance, C. (2025) https://BioRender.com/ dgwdiy8.

Similar articles

References

    1. Rowley, M. J. & Corces, V. G. Organizational principles of 3D genome architecture. Nat. Rev. Genet.19, 789–800 (2018). - PMC - PubMed
    1. van Steensel, B. & Belmont, A. S. Lamina-associated domains: Links with chromosome architecture, heterochromatin, and gene repression. Cell169, 780–791 (2017). - PMC - PubMed
    1. Burke, B. & Stewart, C. L. The nuclear lamins: flexibility in function. Nat. Rev. Mol. Cell Biol.14, 13–24 (2013). - PubMed
    1. Dupont, S. & Wickstrom, S. A. Mechanical regulation of chromatin and transcription. Nat. Rev. Genet.23, 624–643 (2022). - PubMed
    1. Lele, T. P., Dickinson, R. B. & Gundersen, G. G. Mechanical principles of nuclear shaping and positioning. J. Cell Biol.217, 3330–3342 (2018). - PMC - PubMed

LinkOut - more resources