. 2025 Aug 13;23(1):907.
doi: 10.1186/s12967-025-06360-2.

DNA methylation variations of DNA damage response in glioblastoma: NSUN5 modulates tumor-intrinsic cytosolic DNA-sensing and microglial behavior

Affiliations

DNA methylation variations of DNA damage response in glioblastoma: NSUN5 modulates tumor-intrinsic cytosolic DNA-sensing and microglial behavior

An-An Yin et al. J Transl Med. .

Abstract

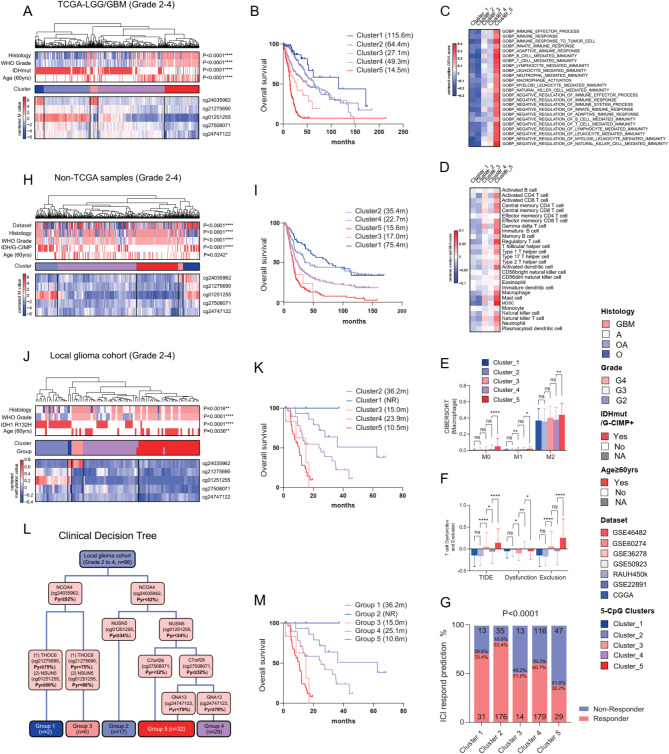
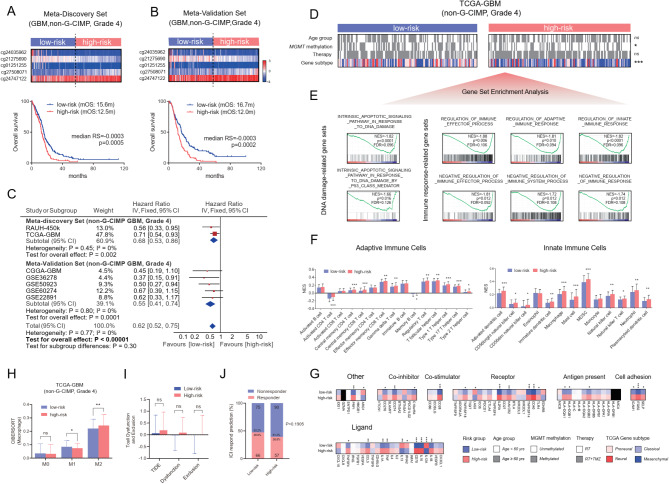
Background: Variations in DNA methylation within the DNA damage response (DDR) mechanism could have significant implications for glioma prognosis and immune responses. This study aimed to explore the global DNA methylation landscape of DDR genes in gliomas and identify key epigenetically regulated genes influencing glioma biology and immunity.

Methods: This study incorporated a range of public and local glioma datasets. Multiple clinical, bioinformatic, and in vitro experimental analyses were conducted to explore clinical and biological aspects.

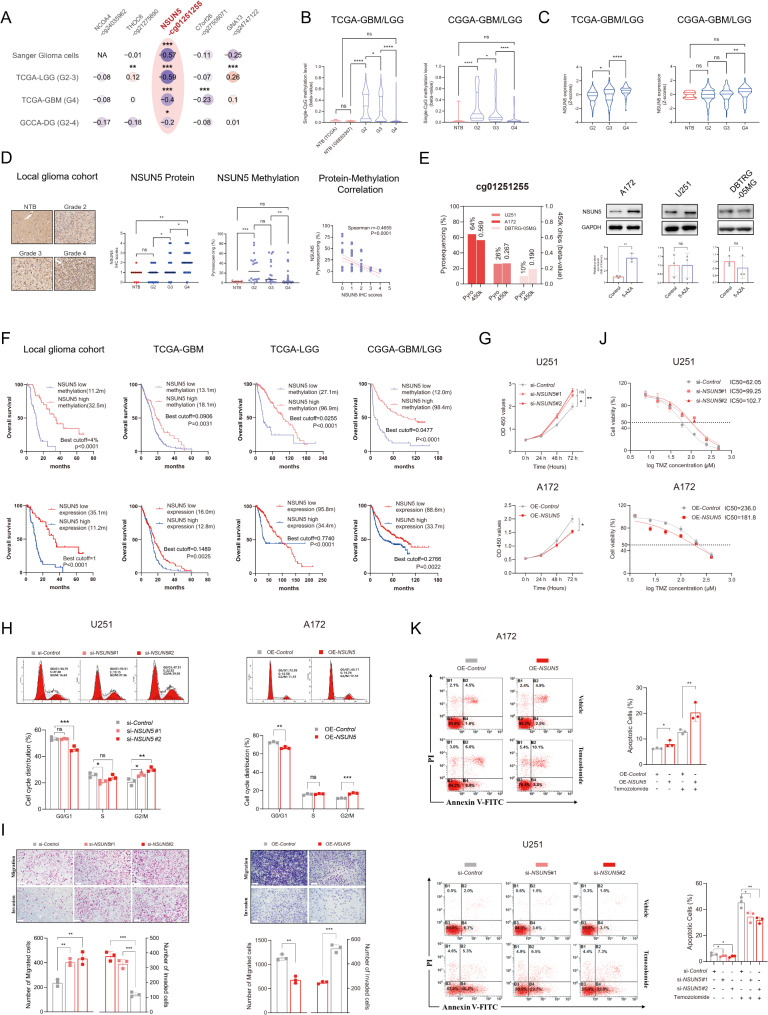
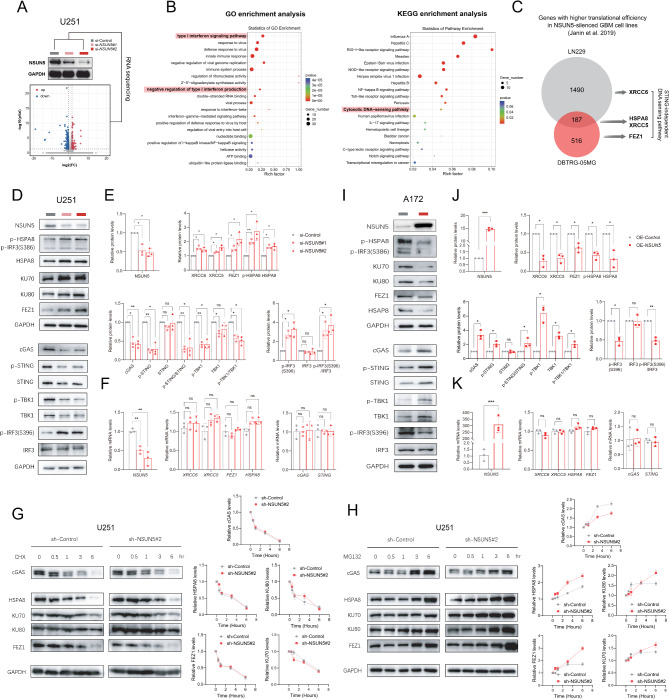
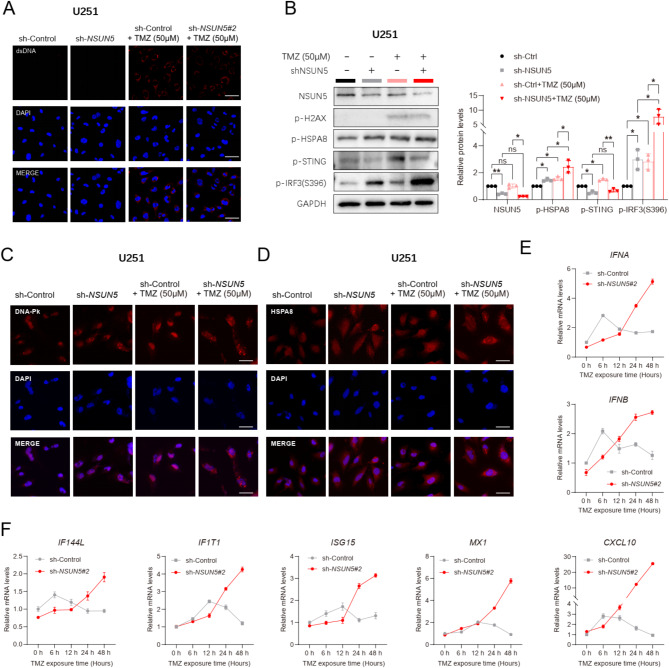
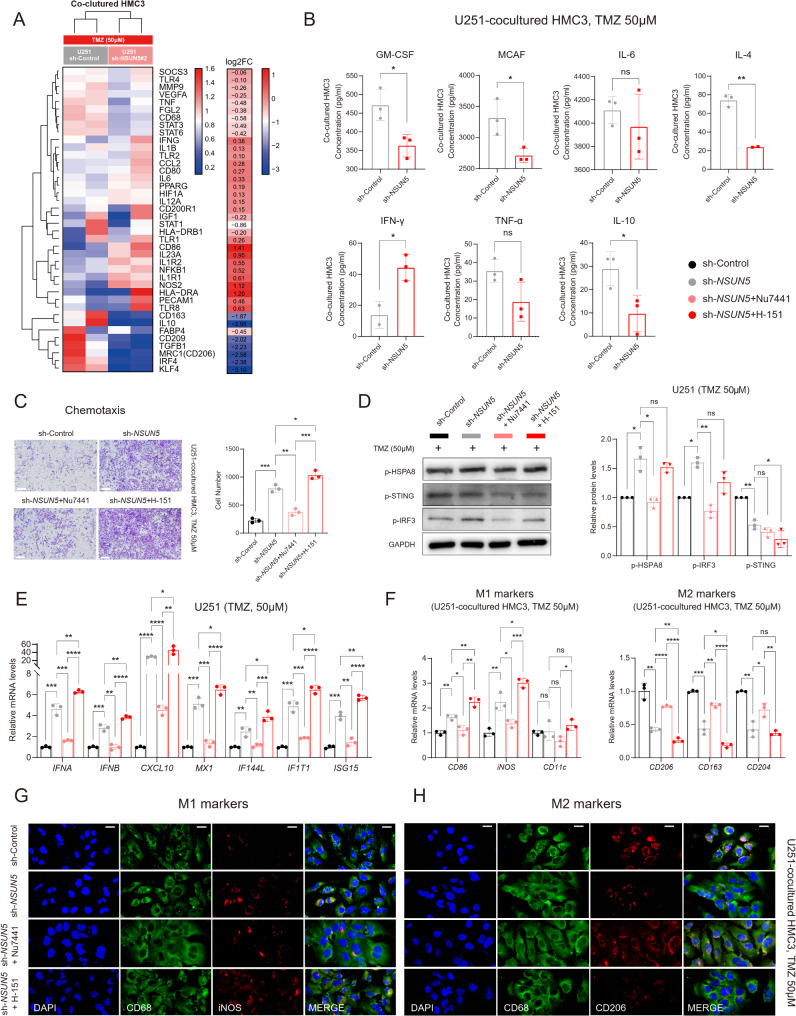
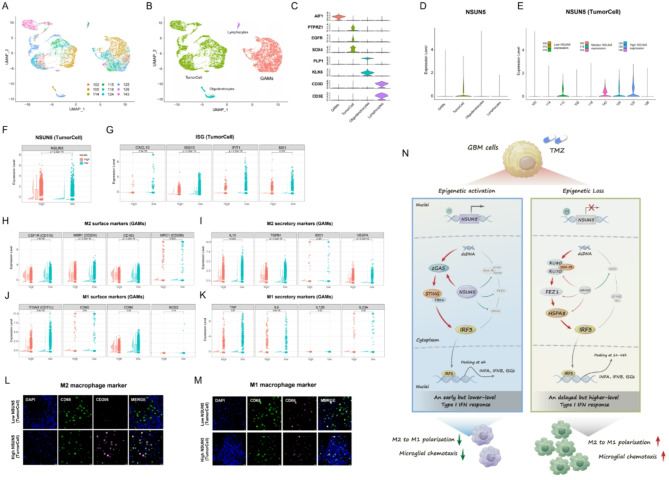
Results: Global DNA methylation variations in DDR genes correlated with distinct glioma prognoses, with five CpGs identified as potent predictors. Hierarchical clustering and a risk-score model based on these CpGs unveiled immune-related prognostic subgroups in glioblastomas (GBMs) and lower-grade gliomas (LGGs). NSUN5, epigenetically regulated by one of these CpGs, highlighted the biological significance of the DDR CpG panel. In vitro, NSUN5 displayed tumor-suppressor-like activities in GBM cells, but clinically, it was an unfavorable prognostic marker. Depletion of NSUN5 shifted cytosolic DNA sensing from a STING-dependent (cGAS-STING) pathway to a STING-independent (DNA-PK-HSPA8) pathway, leading to a delayed but more robust type I interferon (IFN) response in GBM cells and enhancing microglial M1 polarization and chemotaxis. This may partially account for the functional discrepancy of NSUN5 observed between experimental and clinical contexts.

Conclusion: This study highlights the complex interplay between DNA methylation, the DDR mechanism, cytosolic DNA sensing, and glioma immunity. These findings may inspire novel strategies for DNA sensing-based immunotherapy.

Keywords: NSUN5; Cytosolic DNA sensing; DNA damage response; DNA methylation; Glioma.


Conflict of interest statement

Declarations. Ethics approval and consent to participate: Informed consent was obtained from all participants from the Neurosurgery Departments of Rennes and Angers University Hospitals and the Department of Neurosurgery, Xijing Hospital. This study was approved by the Institutional Review Board at Xijing Hospital, Air Force Medical University (No. KY20223039-1). Consent for publication: Not applicable. Competing interests: The authors declare that they have no competing interests.

Figures

Fig. 1
Fig. 1
Hierarchical clustering analysis (HCA) on the selective 5-CpG methylation defined distinct prognostic and immune-relevant glioma subtypes; the heatmaps of glioma clusters defined by HCA on the 5-CpG methylation (Illumina DNA methylation chips) in (A) TCGA and (H) non-TCGA samples; the heatmaps of glioma clusters defined by HCA on 5-CpG methylation (pyrosequencing data) in (J) local glioma cohort; each row represents a CpG and each column represents a sample grouped by HCA; clinical and molecular features are indicated for each sample; survival curves of each glioma clusters in (B) TCGA, (I) non-TCGA and (K) local glioma cohort; (L) a clinical decision tree using the 5-CpG pyrosequencing data and (M) survival curves of each group; (C) the heatmaps of median enrichment scores of immune-relevant gene sets defined by GSVA and (D) median enrichment scores of the abundance of TIICs defined by ssGSEA; (E) macrophage subtypes, (F) T cell dysfunction and exclusion scores and (G) the distribution of predicted responders to ICI therapy among the glioma clusters in TCGA-LGG/GBM
Fig. 2
Fig. 2
Identification and validation of a prognostically and biologically relevant risk-score signature based on the five-CpG methylation in non-G-CIMP GBMs; Survival curves of low-risk and high-risk groups defined by the DDR risk-score signature in (A) meta-discovery cohort of non-G-CIMP GBMs (TCGA-GBM and RAUH-450k collectively), (B) meta-validation cohort of non-G-CIMP GBMs (GSE22891, CGGA-GBM, GSE50923, GSE6074 and GSE36278 collectively); the cutoff was pre-defined as median risk score value (-0.0003) in the meta-discovery cohort; the heatmaps of the five-CpG methylation are shown respectively; each row represents a CpG and each column represents a sample ordered by its risk score; survival curves in each cohort are shown in Supplementary Figure S3; (C) meta-analysis of the 5-CpG risk-score signature in each cohort; (D) the correlation of the risk groups with clinical and molecular features in TCGA-GBM; (E) representative GSEA enrichment plots of the significantly enriched gene sets in high-risk tumors from TCGA-GBM; (F) the abundance of adaptive and innate immune infiltrating cells between low-risk and high-risk tumors from TCGA-GBM; (G) the expression levels of immune checkpoint molecules, (H) macrophage subtypes, (I) T cell dysfunction and exclusion scores and (J) the distribution of predicted responders to ICI therapy between low-risk and high-risk groups from TCGA-GBM; statistical significance at the level of *<0.05, ** <0.01, *** <0.001 and **** <0.0001
Fig. 3
Fig. 3
NSUN5, regulated by DNA methylation, demonstrated anti-tumor activities in GBM cell lines in vitro but served as an unfavorable prognostic biomarker in clinical glioma samples; (A) Pearson correlation analysis between CpG methylation and gene expression for the 5 identified CpGs in different datasets; (B) CpG methylation (cg01251255) and (C) NSUN5 expression between gliomas of all grades and NTB from different datasets; (D) IHC staining of NSUN5 protein and pyrosequencing data in local glioma cohort, and their correlation; scale bar = 50 μm; (E) CpG methylation and protein levels of NSUN5 in different GBM cell lines with demethylation treatment of 5-Aza-dC (10 nM). (F) Survival curves between gliomas with low vs. high NSUN5 methylation (expression) in local glioma cohort and public datasets; best cutoffs are calculated for each cohort by the maximal ranked log-rank statistic; (G) CCK-8 proliferation assay in U251 and A172; (H) Cell cycle assay by flow cytometry in U251 and A172; (I) Migration and invasion assay in U251 and A172; scale bar = 200 μm; (J) TMZ cytotoxicity assay in U251 and A172; (K) Apoptosis assay by flow cytometry in U251 and A172
Fig. 4
Fig. 4
NSUN5 favored switch of cytosolic DNA-sensing modes via differential regulation of translation efficiency in GBM cell lines; (A) Volcano plots of differentially expressed genes (DEGs) from RNA sequencing on U251 cells after transfection of si-Control and si-NSUN5#2; NSUN5 knockdown was confirmed by Western blot; (B) GO and KEGG analysis of enriched pathways using DEGs; (C) Venn diagram of genes with higher translational efficiency in NSUN5-silenced GBM cell lines reported by Janin et al. [15]; (D-E) Western blot images of proteins involved in cGAS-mediated STING-dependent signaling or DNA-PK-HSAP8-mediated STING-independent signaling, and corresponding statistical results in U251; (F) qRT-PCR data in U251; (I-J) Western blot images and corresponding statistical results in A172; (K) qRT-PCR data in A172; (G) Western blot images of CHX treatment experiments for protein degradation; (H) Western blot images of MG132 treatment experiments for protein synthesis
Fig. 5
Fig. 5
Loss of NSUN5, in cooperation with TMZ, enhanced cytosolic DNA-PK-HSAP8 signaling and induced a delayed but more robust type I IFN response; (A) Representative IF images of dsDNA in sh-Control and sh-NSUN5#2 U251, exposed to TMZ (50 µM) or not; scale bar = 50 μm; (B) Western blot images of key proteins in STING-dependent and -independent pathways in U251; (C) Representative IF images of DNA-PK in U251; scale bar = 50 μm; (D) Representative IF images of HSPA8 in U251 cells; scale bar = 50 μm; (E-F) qRT-PCR data of (E) type I IFN genes and (F) IFN-stimulated genes (ISGs) in U251 cells at indicated time points after TMZ treatment (50 µM)
Fig. 6
Fig. 6
Loss of NSUN5, in cooperation with TMZ, promoted microglial M2-to-M1 polarization and chemotaxis, which was reversed by DNA-PK inhibition but amplified by STING inhibition; (A) Macrophage differentiation PCR array of microglial HMC3 co-cultured with sh-Control and sh-NSUN5#2 U251 exposed to TMZ (50 µM); (B) ELISA assay of M1/M2 macrophage cytokines in supernatants of microglial HMC3 co-cultured with sh-Control and sh-NSUN5#2 U251 exposed to TMZ (50 µM); (C) Migration assay of HMC3 co-cultured with sh-Control and sh-NSUN5#2 U251 exposed to TMZ (50 µM), and treated with DNA-PK inhibitor (Nu7441), STING inhibitor (H-151) or vehicle; scale bar = 200 μm; (D) Western blot images of key proteins involved in STING-dependent and -independent signaling, and corresponding statistical results in U251; (E) qRT-PCR data of type I IFN genes and ISGs in sh-Control and sh-NSUN5#2 U251 exposed to TMZ (50 µM), and treated with DNA-PK inhibitor (Nu7441), STING inhibitor (H-151) or vehicle; (E) qRT-PCR data and representative IF images of (G) M1 and (H) M2 macrophage markers in microglial HMC3 co-cultured with sh-Control and sh-NSUN5#2 U251 exposed to TMZ (50 µM), and treated with DNA-PK inhibitor (Nu7441), STING inhibitor (H-151) or vehicle; scale bar = 20 μm
Fig. 7
Fig. 7
Single-cell RNA-Seq data analysis and IF staining in primary GBM samples; Single-cell transcriptome dataset is downloaded from GEO (GSE131928) (A) Nine samples are integrated and cells from each sample are indicated by different colors; (B) Cells are classified into four cell types, including tumor cells, lymphocytes, oligodendrocytes and GAMs; (C) The violin plots of the marker gene expression in the four cell types; (D) The violin plots of NSUN5 expression in the four cell types; (E) The violin plots of NSUN5 expression in tumor cells across the nine samples; based on median NSUN5 expression, GBMs were classified into NSUN5low, NSUN5median, and NSUN5high samples; The violin plots, boxplots and scatter plots of (F) NSUN5 expression in tumor cells, (G) ISG expression in tumor cells, (H) expression of M2 surface markers in GAMs, (I) expression of M2 secretory markers in GAMs, (J) expression of M1 surface markers in GBMs, and (K) expression of M2 secretory markers in GAMs between NSUN5low and NSUN5high samples; (L-M) Representative IF images of M1 and M2 markers in local GBM samples with low and high NSUN5 expression defined by IHC scores; scale bar = 20 μm. (N) Schematic Illustrations for NSUN5 as a Key Modulator of Tumor-Intrinsic Cytosolic DNA-Sensing Modes Influencing Microglial Polarization and Chemotaxis

Similar articles

References

    1. Pouyan A, Ghorbanlo M, Eslami M, et al. Glioblastoma multiforme: insights into pathogenesis, key signaling pathways, and therapeutic strategies. Mol Cancer. 2025;24(1):58. - PMC - PubMed
    1. Rahman R, Shi DD, Reitman ZJ, et al. Dna damage response in brain tumors: a society for neuro-oncology consensus review on mechanisms and translational efforts in neuro-oncology. Neuro Oncol. 2024;26(8):1367–87. - PMC - PubMed
    1. Olivieri M, Cho T, Alvarez-Quilon A, et al. A genetic map of the response to Dna damage in human cells. Cell. 2020;182(2):481–96. - PMC - PubMed
    1. Matarrese P, Signore M, Ascione B, Fanelli G, Paggi MG, Abbruzzese C. Chlorpromazine overcomes Temozolomide resistance in glioblastoma by inhibiting cx43 and essential Dna repair pathways. J Transl Med. 2024;22(1):667. - PMC - PubMed
    1. Kornepati A, Rogers CM, Sung P, Curiel TJ. The complementarity of Ddr, nucleic acids and anti-tumour immunity. Nature. 2023;619(7970):475–86. - PubMed

LinkOut - more resources