

LI-RADS: concordance between energy-integrating computed tomography, photon-counting detector computed tomography and magnetic resonance imaging
- PMID: 40804429
- PMCID: PMC12351820
- DOI: 10.1186/s40644-025-00922-9
LI-RADS: concordance between energy-integrating computed tomography, photon-counting detector computed tomography and magnetic resonance imaging
Abstract
Background: Photon-counting detector CT (PCD-CT) offers technical advantages over energy-integrating detector CT (EID-CT) for liver imaging. However, it is unclear whether these translate into clinical improvements regarding the classification of suspicious liver lesions using the Liver Imaging Reporting and Data System (LI-RADS). This study compared the intra- and intermodal agreement of EID-CT and PCD-CT with Magnetic resonance imaging (MRI) for liver lesion classification.
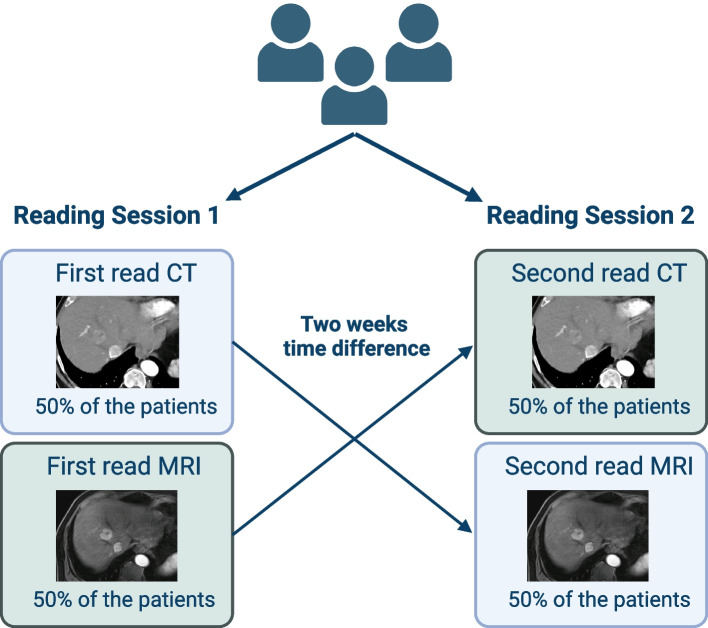
Methods: This retrospective study included patients who underwent EID-CT or PCD-CT and MRI within 30 days between 02/2023 and 01/2024. Three board-certified radiologists assessed LI-RADS classification and presence of LI-RADS major features. Fleiss' Kappa and intraclass correlation coefficients (ICC) were used to evaluate rater agreement.
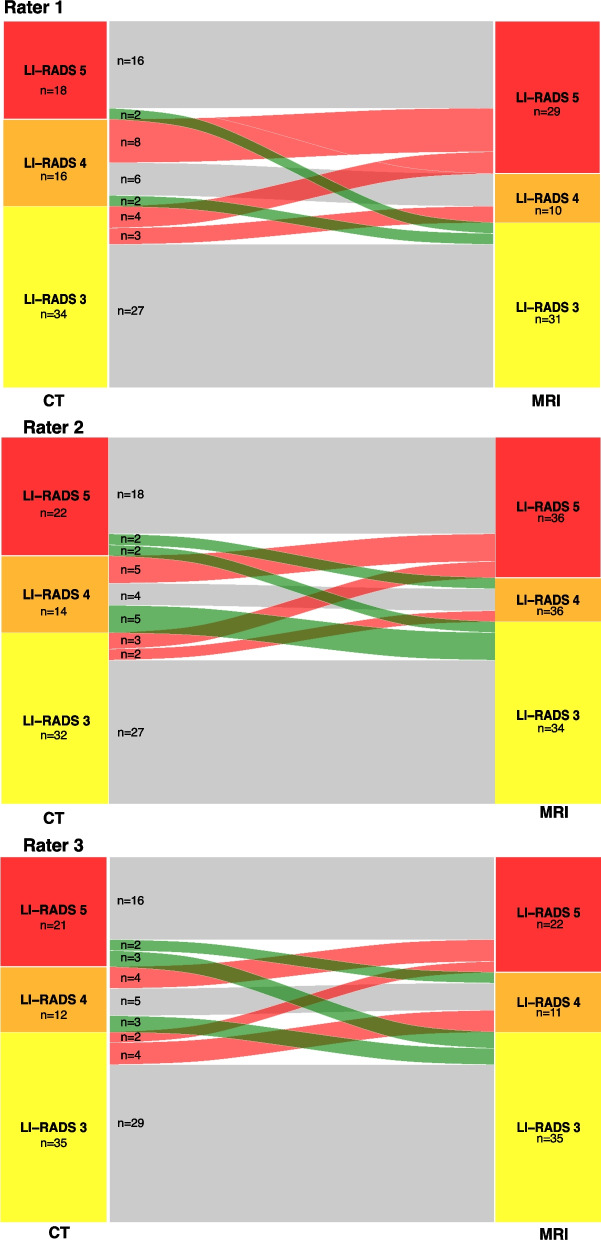
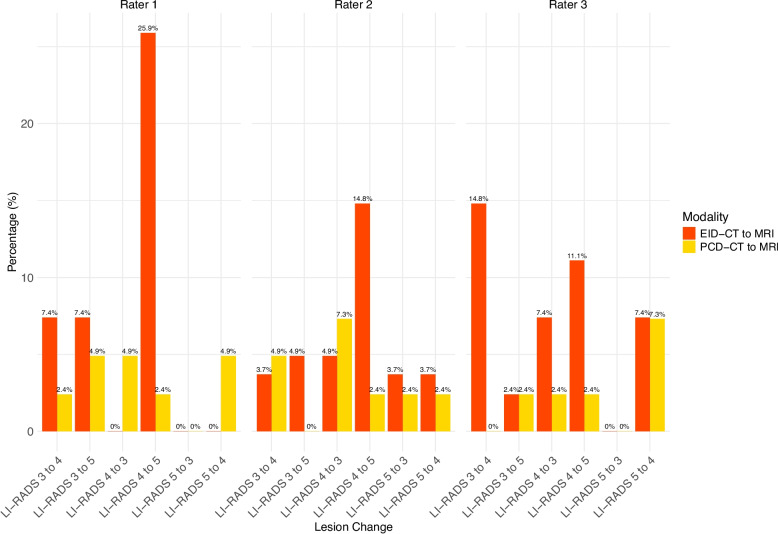
Results: Sixty-eight lesions in 26 patients (mean age 65.0 ± 14.2 years, 19 [73.1%] male) were analyzed. Intramodal inter-rater agreement for LI-RADS classification was 0.88 (0.62-0.88) for EID-CT, 0.90 (0.83-0.94) for PCD-CT, and 0.87 (0.81-0.91) for MRI. Agreement in PCD-CT was substantial for all LI-RADS major features, whereas in EID-CT only for washout. Intermodal agreement between CT and MRI ranged from 0.67 to 0.72. Final intermodal LI-RADS classification agreement was higher for PCD-CT (0.72-0.85) than EID-CT (0.52-0.64).
Conclusions: PCD-CT demonstrated higher intermodal and intramodal agreement for LI-RADS classification and major features than EID-CT. Additionally, PCD-CT shows significantly higher intramodal and inter-rater agreement for LI-RADS classification and greater concordance with MRI compared to EID-CT, reaching substantial to almost perfect agreement. These results suggest a potential benefit of PCD-CT in the management and treatment decision-making of HCC.
Keywords: Accuracy; Hepatocellular Carcinoma; Liver Imaging Reporting & Data System; Magnetic Resonance Imaging; Photon-Counting Computed Tomography.
© 2025. The Author(s).
Conflict of interest statement
Declarations. Ethics approval and consent to participate: The study was also approved by the ethics committee of the Medical Association of Rhineland Palatinate, Mainz, Germany (Permit number 2022–16359). The requirement of obtaining informed consent was waived due to the retrospective design of the study. Competing interests: The authors declare no competing interests.
Figures
Similar articles
-
Photon-counting detector CT for bone defect repair: Unveiling the impact of pore size on osseointegration and the advantage over traditional imaging.Comput Biol Med. 2025 Sep;196(Pt B):110881. doi: 10.1016/j.compbiomed.2025.110881. Epub 2025 Aug 2. Comput Biol Med. 2025. PMID: 40753952
-
Photon-Counting Versus Energy-Integrating Detector CT Angiography of the Lower Extremity in a Human Cadaveric Model With Continuous Extracorporeal Perfusion.Invest Radiol. 2023 Oct 1;58(10):740-745. doi: 10.1097/RLI.0000000000000982. Epub 2023 Apr 22. Invest Radiol. 2023. PMID: 37185253
-
Infrapopliteal Segments on Lower Extremity CTA: Prospective Intraindividual Comparison of Energy-Integrating Detector CT and Photon-Counting Detector CT.AJR Am J Roentgenol. 2024 Mar;222(3):e2329778. doi: 10.2214/AJR.23.29778. Epub 2023 Nov 22. AJR Am J Roentgenol. 2024. PMID: 37991334
-
Contrast-enhanced ultrasound using SonoVue® (sulphur hexafluoride microbubbles) compared with contrast-enhanced computed tomography and contrast-enhanced magnetic resonance imaging for the characterisation of focal liver lesions and detection of liver metastases: a systematic review and cost-effectiveness analysis.Health Technol Assess. 2013 Apr;17(16):1-243. doi: 10.3310/hta17160. Health Technol Assess. 2013. PMID: 23611316 Free PMC article.
-
The added value of artificial intelligence to LI-RADS categorization: A systematic review.Eur J Radiol. 2022 May;150:110251. doi: 10.1016/j.ejrad.2022.110251. Epub 2022 Mar 11. Eur J Radiol. 2022. PMID: 35303556
References
-
- Ginès P, Krag A, Abraldes JG, Solà E, Fabrellas N, Kamath PS. Liver cirrhosis. Lancet. 2021;398(10308):1359–76. - PubMed
-
- Bray F, Laversanne M, Sung H, Ferlay J, Siegel RL, Soerjomataram I, Jemal A. Global cancer statistics 2022: GLOBOCAN estimates of incidence and mortality worldwide for 36 cancers in 185 countries. CA Cancer J Clin. 2024;74(3):229–63. - PubMed
-
- Galle PR, Forner A, Llovet JM, Mazzaferro V, Piscaglia F, Raoul J-L, Schirmacher P, Vilgrain V. EASL clinical practice guidelines: management of hepatocellular carcinoma. J Hepatol. 2018;69(1):182–236. - PubMed
MeSH terms
LinkOut - more resources
Full Text Sources
