

Unlocking microbiota potential: the role of organic copper in enhancing healthy white shrimp (Penaeus vannamei) farming
- PMID: 40804436
- PMCID: PMC12344853
- DOI: 10.1186/s42523-025-00450-8
Unlocking microbiota potential: the role of organic copper in enhancing healthy white shrimp (Penaeus vannamei) farming
Abstract
Background: Microbiota sequencing has emerged a powerful tool for advancing aquatic nutrition research. However, few studies have comprehensively investigated the host microbiota's response to trace minerals. This study examined the role of organic copper supplementation in promoting the health of farmed white shrimp (Penaeus vannamei) from a microbiota perspective.
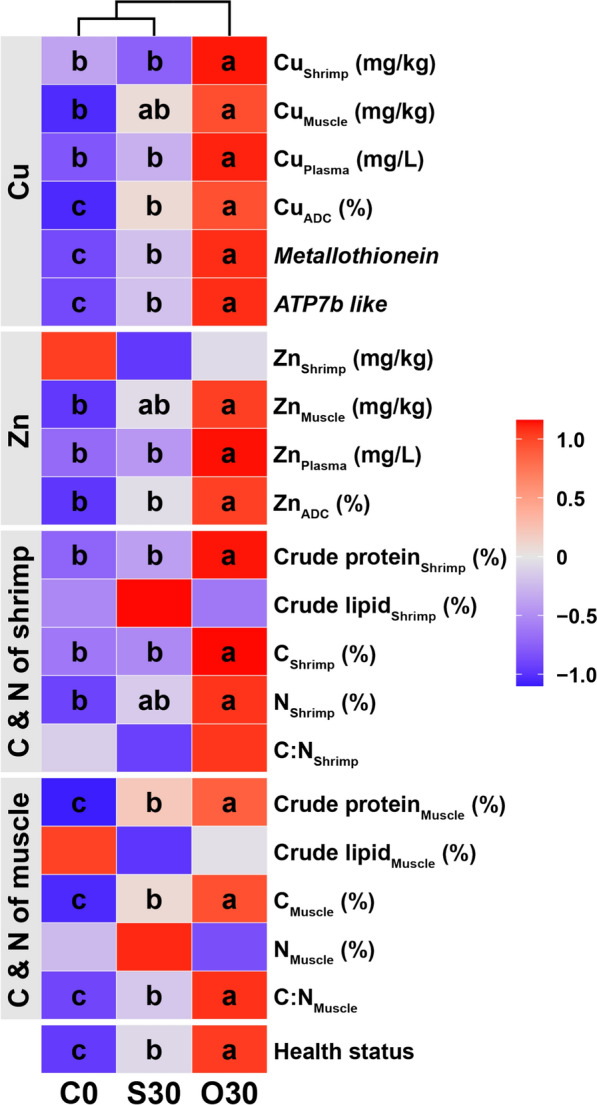
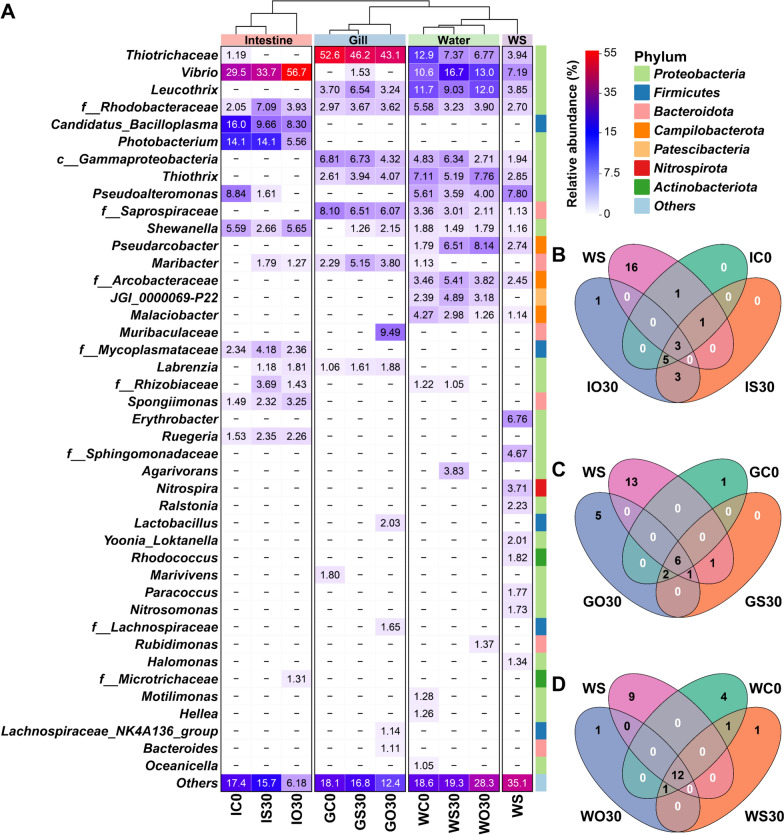
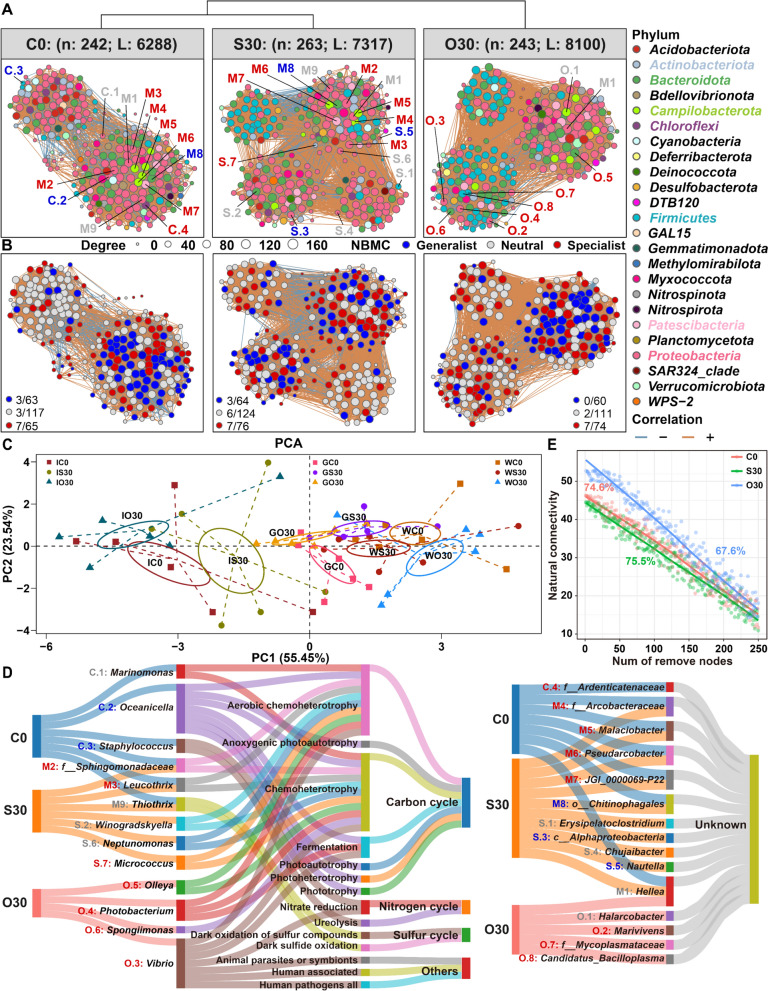
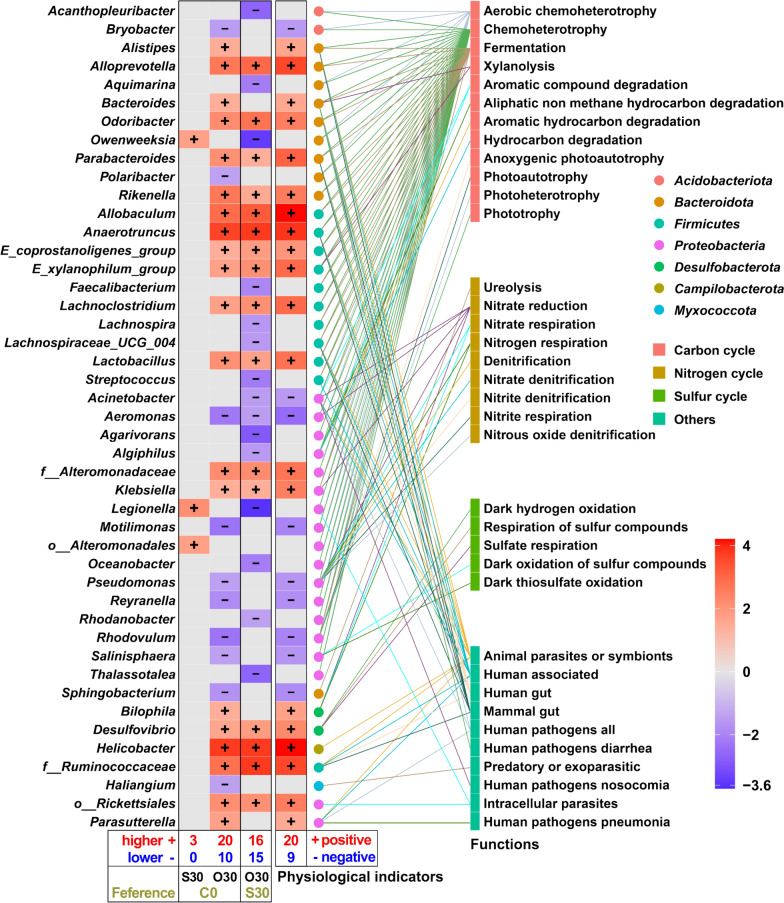
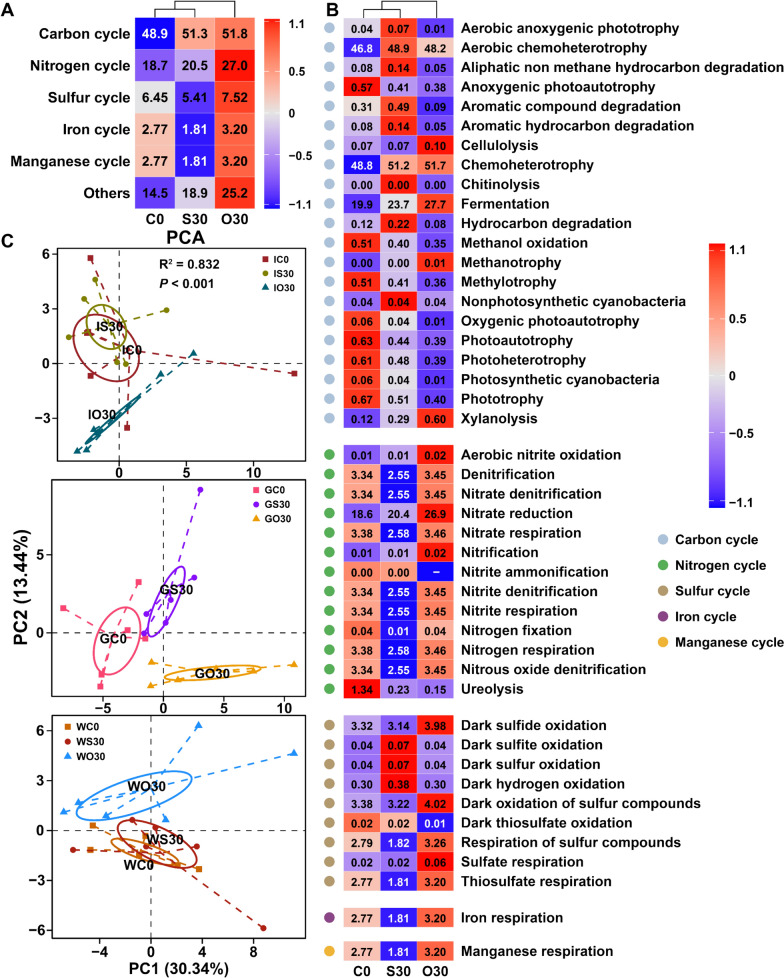
Results: In an 8-week feeding trial, shrimp were fed diets supplemented with no copper, 30 mg/kg inorganic copper (CuSO4·5H2O) or organic copper (Cu-proteinate). The apparent digestibility coefficients of copper and zinc, along with carbon and nitrogen assimilation, were determined. The V3-V4 region of the 16S rRNA gene was sequenced from feeds, intestines, gills, and water samples. Shrimp that fed the organic copper diet demonstrated healthier physiological status, higher apparent digestibility coefficients of both copper and zinc, as well as greater accumulation of copper, zinc, carbon, and nitrogen. The organic copper group exhibited distinct microbial diversity and a more complex microbial co-occurrence network, characterized by enhanced natural connectivity and robustness. Keystone taxa, including Vibrio, Candidatus_Bacilloplasma, and Photobacterium, contributed to network stability. Taxa associated with nutrient metabolism, including Butyricicoccus, Lactobacillus, and genera in the family Lachnospiraceae, Prevotellaceae, Rikenellaceae and Ruminococcaceae, were significantly enriched, correlating well with improved nutritional profiles. In accordance, functional annotation revealed that the organic copper group exhibited higher abundances of functional modules associated with nutrient and energy metabolism such as carbon and nitrogen cycling. Furthermore, host-selective pressure shaped the unique microbiota composition in the intestine and gill, which differed from the surrounding water and water source, with the gill microbiota potentially serving as a transitional bridge shaping the intestinal microbiota.
Conclusions: More stable host microbiota, enriched nutrient-metabolizing taxa, and enhanced ecological cycling in this study provide a potential strategy for innovative aqua-feed development. Our findings offer novel microbiota-centric insights into the role of organic copper in healthy shrimp farming.
Keywords: Penaeus vannamei; Healthy farming; Host microbiota; Microbiota community stability; Microbiota functions; Microecological niches; Organic copper.
© 2025. The Author(s).
Conflict of interest statement
Declarations. Conflict of interest: The authors declare no competing interests. Ethics approval and consent to participate: The Animal Care Committee of Ocean University of China approved the animal care and treatment procedures.
Figures


Similar articles
-
Effects of Bacillus licheniformis on the water quality, growth performance and bacterial community in Penaeus vannamei aquaculture system.Front Microbiol. 2025 Jun 2;16:1595680. doi: 10.3389/fmicb.2025.1595680. eCollection 2025. Front Microbiol. 2025. PMID: 40529589 Free PMC article.
-
Effects of extruded corn distillers dried grains with solubles on growth performance, nutrient digestibility, gut health, and microbiota diversity in weaned piglets.J Anim Sci. 2025 Jan 4;103:skaf120. doi: 10.1093/jas/skaf120. J Anim Sci. 2025. PMID: 40244394
-
Integrated commercial and low-fishmeal fermented feed boosts survival and modulates intestinal microbiota in pacific white shrimp (Litopenaeus vannamei).Anim Nutr. 2025 May 5;22:98-112. doi: 10.1016/j.aninu.2025.01.011. eCollection 2025 Sep. Anim Nutr. 2025. PMID: 40843218 Free PMC article.
-
NTP Developmental and Reproductive Toxicity Technical Report on the Prenatal Development Studies of 2-((1-(4-Phenoxyphenoxy)propan-2-yl)oxy)pyridine (CASRN 95737-68-1) in Sprague Dawley (Hsd:Sprague Dawley® SD®) Rats and New Zealand White (Hra:NZW SPF) Rabbits: DART Report 07 [Internet].Research Triangle Park (NC): National Toxicology Program; 2022 Jan. Research Triangle Park (NC): National Toxicology Program; 2022 Jan. PMID: 35593777 Free Books & Documents. Review.
-
The Black Book of Psychotropic Dosing and Monitoring.Psychopharmacol Bull. 2024 Jul 8;54(3):8-59. Psychopharmacol Bull. 2024. PMID: 38993656 Free PMC article. Review.
References
-
- FAO. The State of World Fisheries and Aquaculture 2024. Rome: FAO; 2024.
-
- Truong HH, Hines BM, Emerenciano MG, Blyth D, Berry S, Noble TH, et al. Mineral nutrition in penaeid shrimp. Rev Aquac. 2023;15:1355–73.
-
- Huang F, Wang L, Zhang C, Song K. Replacement of fishmeal with soybean meal and mineral supplements in diets of Litopenaeus vannamei reared in low-salinity water. Aquaculture. 2017;473:172–80.
-
- Lall SP. The minerals. Fish Nutr. Elsevier; 2022. p. 469–554.
-
- Chen H, Huang X, Tayyab M, Zhao M, Yao D, Zheng Z, et al. Copper Homeostasis and Its Impact on Innate Immunity in Crustaceans. Rev Aquac. 2025;17:e12963.
Grants and funding
LinkOut - more resources
Full Text Sources