

A cost-utility analysis of newborn screening for spinal muscular atrophy in Canada
- PMID: 40804727
- PMCID: PMC12351935
- DOI: 10.1186/s13023-025-03927-6
A cost-utility analysis of newborn screening for spinal muscular atrophy in Canada
Abstract
Background: Spinal muscular atrophy (SMA) is a neuromuscular disorder caused by the loss of the SMN1 gene, with an estimated birth prevalence of about 1 in 10,000. Early intervention with disease-modifying therapies (DMTs) significantly improves outcomes. This study evaluates the economic implications and health benefits of newborn screening (NBS) for SMA in Canada from the societal perspective.
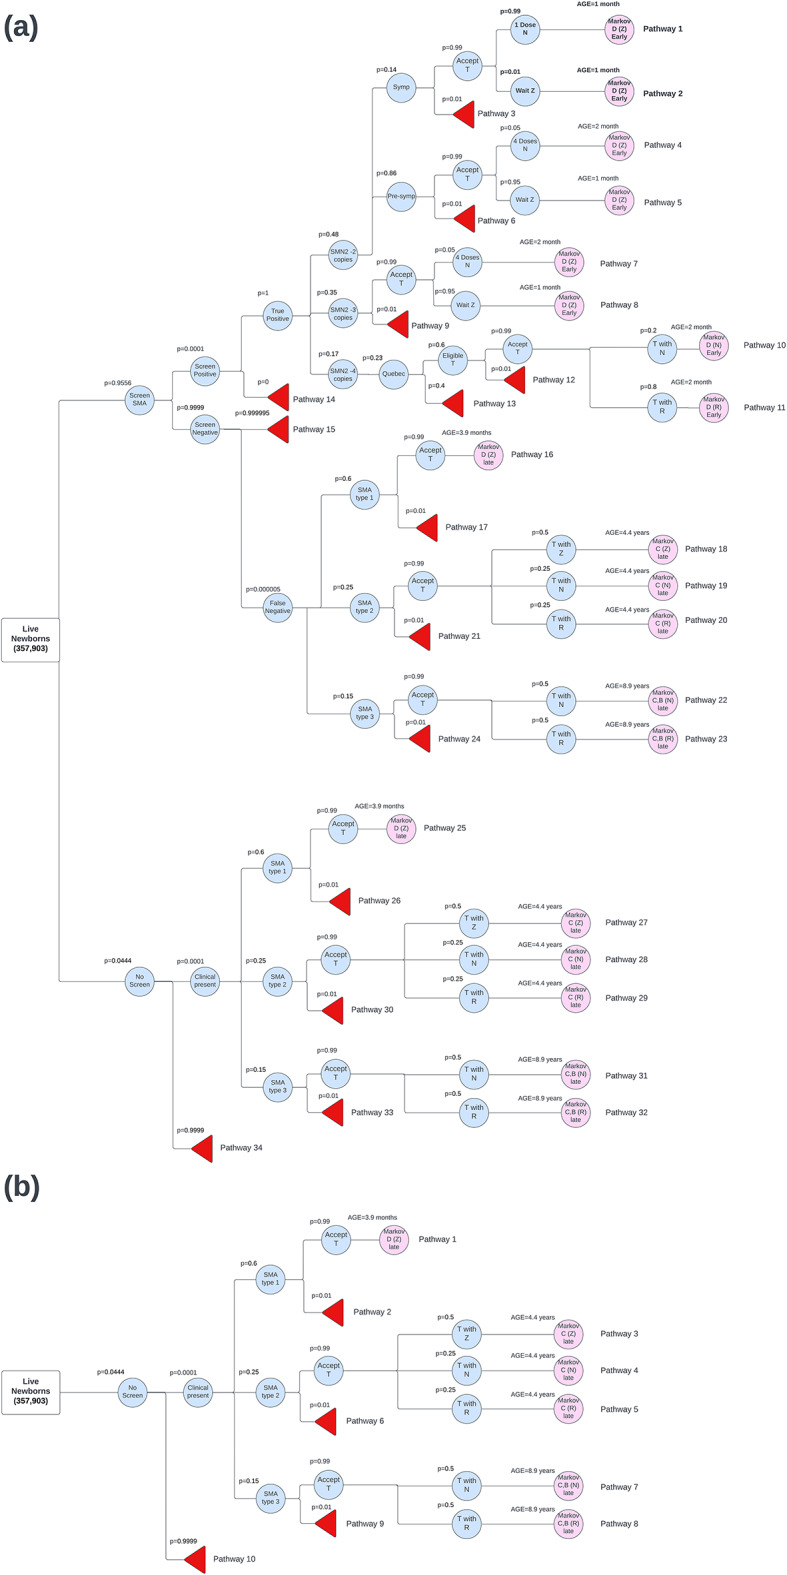
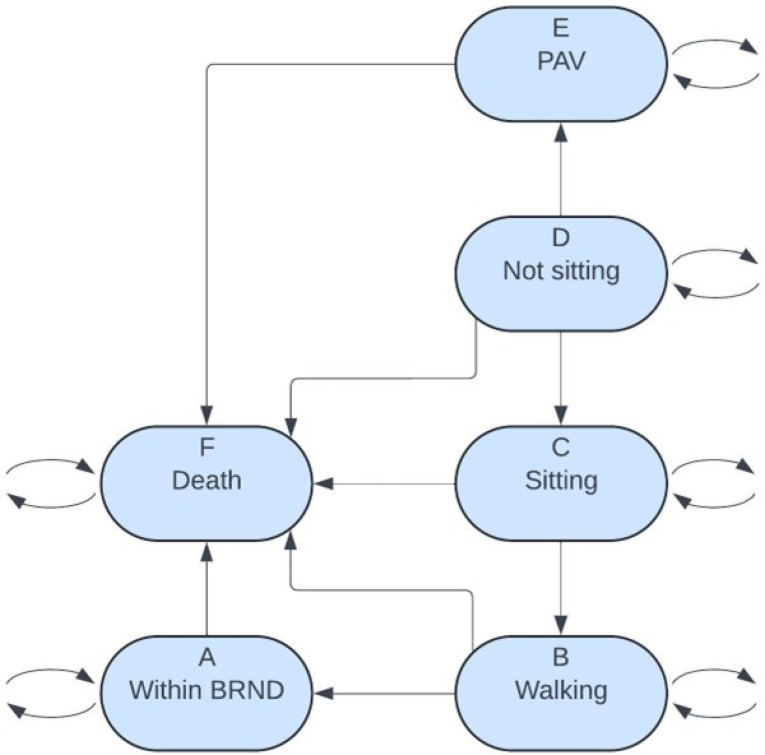
Methods: A decision analytic model was developed, which combined a decision tree for the screening algorithm and a Markov model for long-term health outcomes. The Markov model included health states based on WHO motor milestones. The population cohort of 357,903 live newborns reflects the 2022-2023 births in Canada. Screening is performed on dried blood spot testing which evaluates for biallelic deletions in SMN1. Cost inputs encompassed treatment and health state costs, while utility values reflected quality of life in each health state.
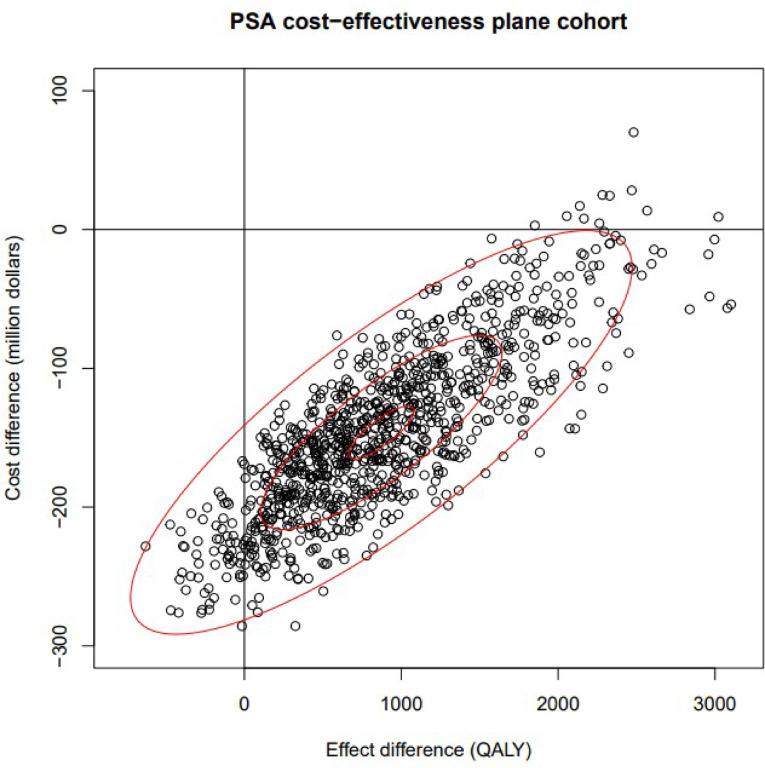
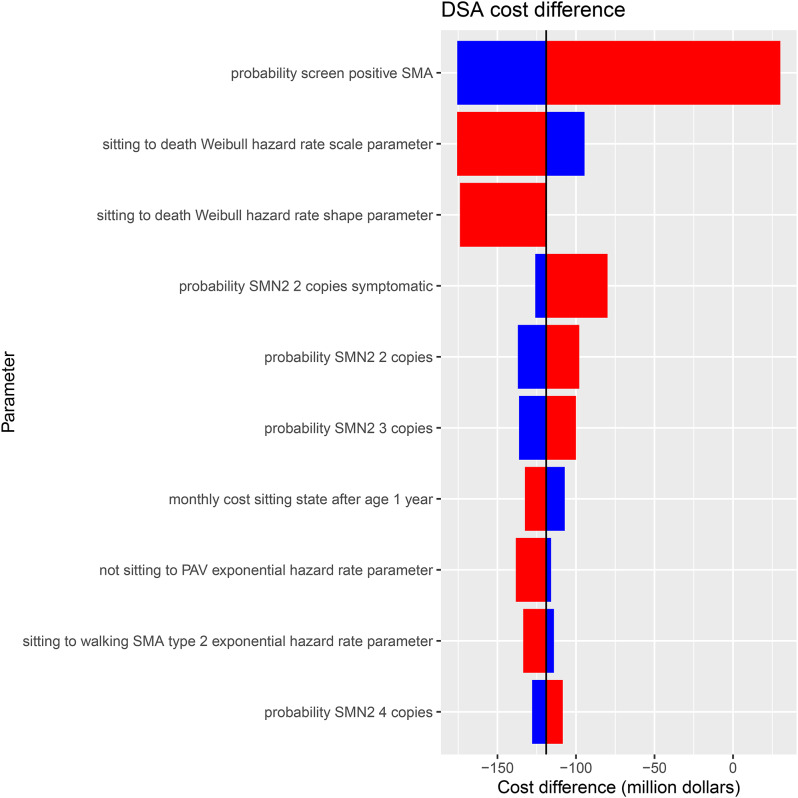
Results: NBS for SMA is expected to identify 37.1 (95% CI: 15.0, 70.7) newborns annually in Canada. Our analysis over a lifetime horizon and a discount rate of 1.5% shows NBS and early treatment has an incremental cost of -$146,187,000 (95% CI: -249,773,777 to - 17,890,034) and incremental benefit of 872 (95% CI: -193, 2329) quality-adjusted life years (QALYs) compared to no NBS and late treatment. This resulted in a mean ICER value of -$173,572/QALY.
Conclusion: The decision analytic model indicated that overall NBS is cost-saving and more effective than no NBS and late treatment in the Canadian health system.
Keywords: Canadian health system; Cost-Utility analysis; Decision tree; Economic evaluation; Markov model; Newborn screening; Spinal muscular atrophy.
© 2025. The Author(s).
Conflict of interest statement
Declarations. Ethics approval and consent to participate: Not applicable. Consent for publication: Not applicable. Competing interests: HM has been a consultant and received honararia from Novartis Gene Therapies Inc, Hoffman La-Roche Ltd and Pfizer. He has participated in clinical trials with Roche, PTC Therapeutics, Biogen, DYNE, PepGen, ReveraGen, Catabasis, Novartis, and Sarepta. MO has received research support from Roche Genetech, Novartis, Santhera, Muscular Dystrophy Canada, Canadian Institutes of Health Research. PC has received research support from Biogen, Biomarin, Takeda, Cambrooke, Vitaflo, Nutricia, NFDC, CIHR and CF foundation. He has also served on advisory boards for Sanofi, Ultragenyx, Waters and Horizon. JR and his employer (The Institute of Health Economics) received no additional funding directly related to this work. AP has no disclosures to report. CP has no disclosures to report. WR has no disclosures to report. AM has no disclosures to report.
Figures
Similar articles
-
Spinal Muscular Atrophy.2000 Feb 24 [updated 2024 Sep 19]. In: Adam MP, Feldman J, Mirzaa GM, Pagon RA, Wallace SE, Amemiya A, editors. GeneReviews® [Internet]. Seattle (WA): University of Washington, Seattle; 1993–2025. 2000 Feb 24 [updated 2024 Sep 19]. In: Adam MP, Feldman J, Mirzaa GM, Pagon RA, Wallace SE, Amemiya A, editors. GeneReviews® [Internet]. Seattle (WA): University of Washington, Seattle; 1993–2025. PMID: 20301526 Free Books & Documents. Review.
-
The effectiveness and cost-effectiveness of carmustine implants and temozolomide for the treatment of newly diagnosed high-grade glioma: a systematic review and economic evaluation.Health Technol Assess. 2007 Nov;11(45):iii-iv, ix-221. doi: 10.3310/hta11450. Health Technol Assess. 2007. PMID: 17999840
-
Adefovir dipivoxil and pegylated interferon alfa-2a for the treatment of chronic hepatitis B: a systematic review and economic evaluation.Health Technol Assess. 2006 Aug;10(28):iii-iv, xi-xiv, 1-183. doi: 10.3310/hta10280. Health Technol Assess. 2006. PMID: 16904047
-
Cost-effectiveness of enzalutamide with androgen-deprivation therapy (ADT) versus ADT alone for the treatment of high-risk biochemically recurrent non-metastatic castration-sensitive prostate cancer in Canada.J Med Econ. 2025 Dec;28(1):766-777. doi: 10.1080/13696998.2025.2503660. Epub 2025 May 23. J Med Econ. 2025. PMID: 40395149
-
Surveillance of Barrett's oesophagus: exploring the uncertainty through systematic review, expert workshop and economic modelling.Health Technol Assess. 2006 Mar;10(8):1-142, iii-iv. doi: 10.3310/hta10080. Health Technol Assess. 2006. PMID: 16545207
References
-
- Groulx-Boivin E, Osman H, Chakraborty P, Lintern S, Oskoui M, Selby K, et al. Variability in newborn screening across canada: spinal muscular atrophy and beyond. Can J Neurol Sci. 2024;51(2):203–9. - PubMed
Grants and funding
LinkOut - more resources
Full Text Sources
Research Materials
Miscellaneous
