

A deep learning derived prostate zonal volume-based biomarker from T2-weighted MRI to distinguish between prostate cancer and benign prostatic hyperplasia
- PMID: 40804780
- PMCID: PMC12351090
- DOI: 10.1002/mp.18053
A deep learning derived prostate zonal volume-based biomarker from T2-weighted MRI to distinguish between prostate cancer and benign prostatic hyperplasia
Abstract
Background: Benign prostatic hyperplasia (BPH) and prostate cancer (PCa) share overlapping characteristics on magnetic resonance imaging (MRI), confounding the diagnosis and detection of PCa. There is thus a clinical need to accurately differentiate BPH-Only from BPH-PCa to prevent overdiagnosis and unnecessary biopsies. Although BPH and PCa may share overlapping features, they are distinct clinical entities. Previous evidence suggests that prostate peripheral zone (PZ) and transition zone (TZ) volumes on MRI are differentially associated in patients with BPH-PCa versus those with BPH-Only.
Purpose: To develop and validate the ratio of machine learning derived PZ and TZ volumes on T2-weighted (T2W) MRI as an imaging biomarker to distinguish BPH-PCa and BPH-Only.
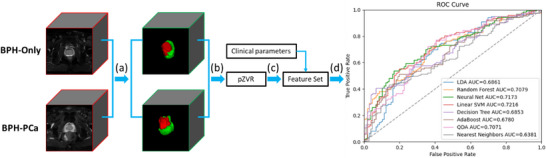
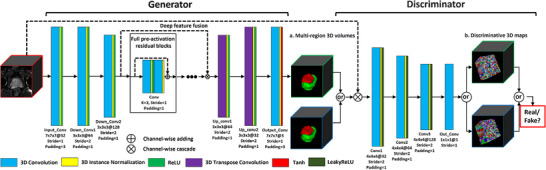
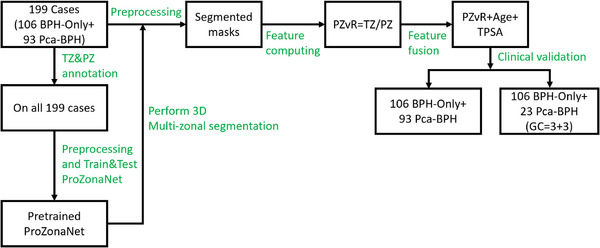
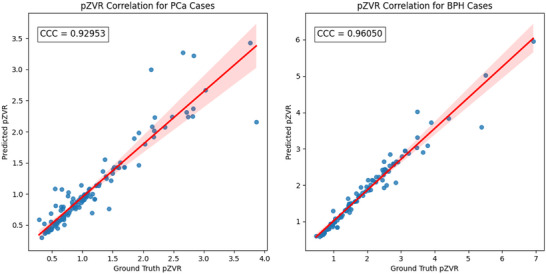
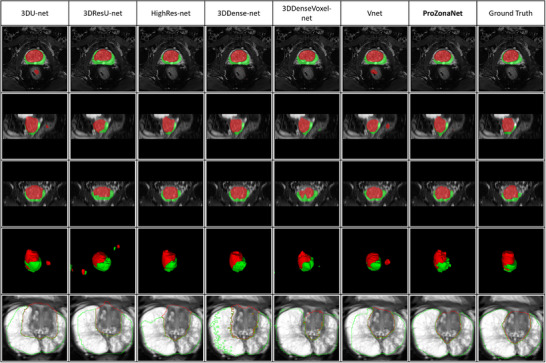
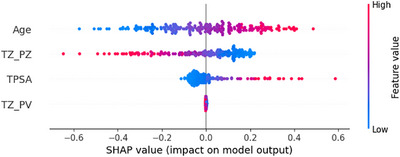
Methods: In this single-center, retrospective study, we identified N = 199 patients (106 BPH-Only and 93 with both BPH-PCa) who underwent a three Tesla multi-parametric MRI before systematic biopsy. A radiologist and a urologist jointly annotated PZ and TZ regions of interest on T2W, involving all 199 cases. We presented and trained a 3D conditional generative adversarial network (cGAN)-based prostate zone volume segmentation model (ProZonaNet) to segment 3D prostate TZ, PZ volumes on T2W MRI. We used 139 cases (with 7× data augmentation, yielding 973 training volumes) and an independent test set of 60 cases to train and evaluate ProZonaNet. ProZonaNet was optimized in terms of dice similarity coefficient (DSC). We then computed prostate zonal volume ratio (pZVR = TZ/PZ) from both ProZonaNet segmentations and ground-truth annotations on all 199 cases, evaluating agreement using Concordance Correlation Coefficient (CCC). The pZVR biomarker was assessed for its ability to distinguish BPH-PCa from BPH-Only. Univariate and multivariate analyses were performed to evaluate the independent effect of pZVR over clinical parameters.
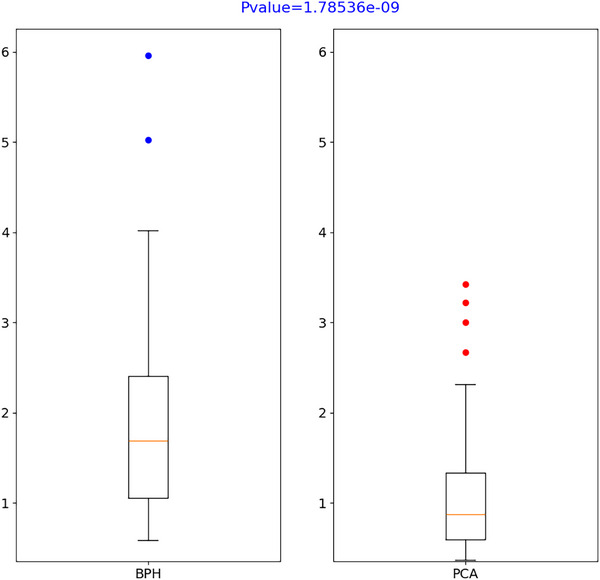
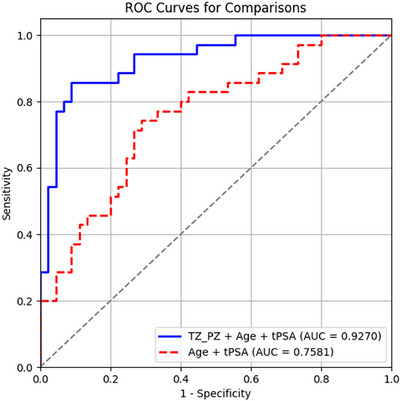
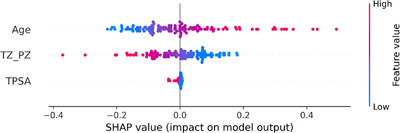
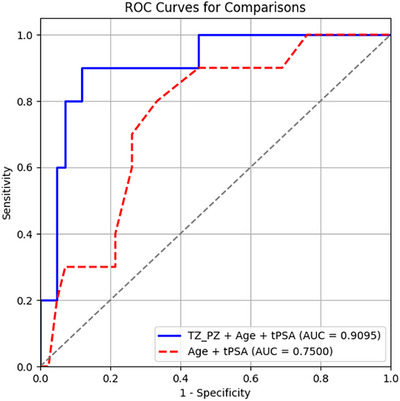
Results: ProZonaNet achieved a mean mDICE of 92.5% on the independent test set (N = 60), outperforming state-of-the-art 3D segmentation models. The computed pZVR showed high agreement with ground-truth annotations, with CCC values of 0.960 for BPH-Only and 0.930 for BPH-PCa cases. The pZVR computed using ProZonaNet, along with two other clinical parameters, including age and prostate-specific antigen, improved the AUC from 0.758 to 0.927 in distinguishing between BPH-Only and BPH-PCa. At the same time, on a subset of low-grade prostate cancer cases (106 BPH-Only and 23 BPH-PCa with Gleason Score = 3+3), the integrated pZVR model improved the AUC from 0.750 to 0.910 in distinguishing between patients with BPH-Only versus BPH-PCa. On both univariate and multivariate analyses, pZVR demonstrated significant discrimination between patients with BPH-Only versus BPH-PCa.
Conclusions: We demonstrated that the prostate zonal volume ratio computed with our ProZonaNet can be used to differentiate benign prostatic hyperplasia from prostate cancer on MRI. These results demonstrate the feasibility of non-invasive diagnosis of BPH-PCa, potentially aiding in the ability to distinguish PCa from benign cancer confounders such as BPH-Only.
Keywords: MRI multi‐region 3D segmentation; cGAN; prostate cancer.
© 2025 The Author(s). Medical Physics published by Wiley Periodicals LLC on behalf of American Association of Physicists in Medicine.
Conflict of interest statement
Dr. Anant Madabhushi is a Research Career Scientist at the Atlanta Veterans Affairs Medical Center. He is an equity holder in Picture Health, Elucid Bioimaging, and Inspirata Inc., and currently serves on the advisory board of Picture Health. He consults for Takeda Inc. and has sponsored research agreements with AstraZeneca and Bristol Myers‐Squibb. His technology has been licensed to Picture Health and Elucid Bioimaging. He is also involved in one NIH R01 grant with Inspirata Inc. All other authors declare no competing financial interests.
Figures
Similar articles
-
Prescription of Controlled Substances: Benefits and Risks.2025 Jul 6. In: StatPearls [Internet]. Treasure Island (FL): StatPearls Publishing; 2025 Jan–. 2025 Jul 6. In: StatPearls [Internet]. Treasure Island (FL): StatPearls Publishing; 2025 Jan–. PMID: 30726003 Free Books & Documents.
-
An integrated nomogram combining deep learning, Prostate Imaging-Reporting and Data System (PI-RADS) scoring, and clinical variables for identification of clinically significant prostate cancer on biparametric MRI: a retrospective multicentre study.Lancet Digit Health. 2021 Jul;3(7):e445-e454. doi: 10.1016/S2589-7500(21)00082-0. Lancet Digit Health. 2021. PMID: 34167765 Free PMC article.
-
Machine learning models for discriminating clinically significant from clinically insignificant prostate cancer using bi-parametric magnetic resonance imaging.Diagn Interv Radiol. 2025 Jul 8;31(4):313-320. doi: 10.4274/dir.2024.242856. Epub 2024 Oct 1. Diagn Interv Radiol. 2025. PMID: 39354727 Free PMC article.
-
MRI software and cognitive fusion biopsies in people with suspected prostate cancer: a systematic review, network meta-analysis and cost-effectiveness analysis.Health Technol Assess. 2024 Oct;28(61):1-310. doi: 10.3310/PLFG4210. Health Technol Assess. 2024. PMID: 39367754 Free PMC article.
-
Magnetic resonance perfusion for differentiating low-grade from high-grade gliomas at first presentation.Cochrane Database Syst Rev. 2018 Jan 22;1(1):CD011551. doi: 10.1002/14651858.CD011551.pub2. Cochrane Database Syst Rev. 2018. PMID: 29357120 Free PMC article.
References
-
- Siegel RL, Miller KD, Wagle NS, Jemal A. Cancer statistics, 2023. Ca Cancer J Clin. 2023;73(1):17‐48. - PubMed
MeSH terms
Grants and funding
- R01CA249992-01A1/CA/NCI NIH HHS/United States
- R01CA216579-01A1/CA/NCI NIH HHS/United States
- R01CA257612-01A1/CA/NCI NIH HHS/United States
- R01CA264017-01/CA/NCI NIH HHS/United States
- R01CA268287-01A1/CA/NCI NIH HHS/United States
- U01CA113913-16A1/CA/NCI NIH HHS/United States
- U01CA239055-01/CA/NCI NIH HHS/United States
- U01CA269181-01/CA/NCI NIH HHS/United States
- U24CA274494-01/CA/NCI NIH HHS/United States
- U54CA254566-01/CA/NCI NIH HHS/United States
- R01HL151277-01A1/HL/NHLBI NIH HHS/United States
- R01HL158071-01A1/HL/NHLBI NIH HHS/United States
- R01AI175555/National Institute of Allergy and Infectious Diseases
- R21DE032344-01/DE/NIDCR NIH HHS/United States
- IBX004121/United States Department of Veterans Affairs VA Merit Review
- IBX006020/United States Department of Veterans Affairs VA Merit Review
- I01CX002622/VA Biomedical Laboratory Research and Development Service
- I01CX002776/VA Biomedical Laboratory Research and Development Service
- IK6BX006185/VA Biomedical Laboratory Research and Development Service
- LPOP-L0021/VA Research and Development Office through the Lung Precision Oncology Program
- W81XWH-15-1-0558/Office of the Assistant Secretary of Defense for Health Affairs through the Prostate Cancer Research Program
- W81XWH-20-1-0851/Office of the Assistant Secretary of Defense for Health Affairs through the Prostate Cancer Research Program
- W81XWH-21-1-0160/Office of the Assistant Secretary of Defense for Health Affairs through the Prostate Cancer Research Program
LinkOut - more resources
Full Text Sources
Medical
