A comprehensive comparative study of generative adversarial network architectures for synthetic computed tomography generation in the abdomen
- PMID: 40804793
- PMCID: PMC12351101
- DOI: 10.1002/mp.18038
A comprehensive comparative study of generative adversarial network architectures for synthetic computed tomography generation in the abdomen
Abstract
Background: Magnetic Resonance (MR)-based synthetic Computed Tomography (sCT) generation is an emerging promising technique, required for the transition from conventional planning workflows to MR-only radiotherapy planning. This shift aims to replace CT acquisition with a sCT improving both cost efficiency and burden to the patient. Generative Adversarial Networks (GANs) have shown some of the best performance in this area.
Purpose: This study aims to identify optimal approaches to improve the quality and clinical applicability of MR-based sCT generation for treatment planning by performing an extensive comparison of GAN architectures and parameters thereof. It focuses on the abdominal region, which still lacks certified medical products for sCT generation.
Methods: In order to improve the current state of deep learning technologies, we generated sCTs based on abdominal MR images of 154 cancer patients using GANs, varying the following parameters: (1) generator architectures (U-Net, ResNet); (2) GAN architectures trained in paired (Pix2Pix) and unpaired fashion (CycleGAN and CUT); (3) number of input-output channels (2D, 2.5D); (4) training set size. The quality of sCT generation was assessed by using both image similarity and dosimetric metrics; correlation between the two was evaluated. The dosimetric accuracy was evaluated through an automated process that compared the dose distributions of photon treatment plans calculated on sCT and CT images, using Dose-Volume Histogram (DVH) parameters for tumor and organs at risk.
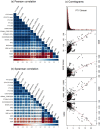
Results: The Pix2Pix model, trained in paired fashion with 2.5D input-output channels and a ResNet generator emerged as the best-performing model, achieving a mean absolute error (MAE, mean) of 63.21 HU, a planning target volume Dmean difference of -0.09%, and no outliers above 2% for other DVH parameters. This configuration addressed prior challenges of Pix2Pix with bone and rigid organ boundary generation, delivering robust results even for cases with significant air pockets. The 2D input-output channel configuration showed beneficial for GANs trained in unpaired fashion, achieving a mean MAE of 66.97 HU for CycleGAN and 69.49 HU for CUT. Both delivered clinically applicable results, with mean DVH discrepancies below 0.8%. Expanding the training set size was essential for minimizing outliers in dosimetric parameters. High correlation was observed between the image similarity metrics-MAE, MAE bones, structural similarity index measure-and target DVH parameters, with Pearson coefficients ranging from 0.77 to 0.9. However, within the clinically relevant range of DVH deviations (± 2%), stochastic variations obscured linear trends.
Conclusions: The study provided a new benchmark for the abdominal sCT generation task, showing its clinical applicability for treatment planning and further advancing the state-of-the-art. This study also confirmed that image similarity metrics alone can not reliably predict small dosimetric deviations within a clinical threshold; but contributed by identifying specific metrics that correlate with DVH discrepancies above ± 5%, offering valuable tools for training, evaluation, and standardization of reporting across studies.
Keywords: MR‐only radiotherapy; deep learning; generative adversarial networks; medical image analysis; synthetic CT.
© 2025 The Author(s). Medical Physics published by Wiley Periodicals LLC on behalf of American Association of Physicists in Medicine.
Conflict of interest statement
The Department of Radiation Oncology, University Hospital Zurich has teaching and research agreements with Siemens Healthineers. University Hospital Zurich had teaching and research agreements with Viewray Inc.
Figures


Similar articles
-
Simulation-free workflow for lattice radiation therapy using deep learning predicted synthetic computed tomography: A feasibility study.J Appl Clin Med Phys. 2025 Jul;26(7):e70137. doi: 10.1002/acm2.70137. Epub 2025 Jun 12. J Appl Clin Med Phys. 2025. PMID: 40504103 Free PMC article.
-
Prescription of Controlled Substances: Benefits and Risks.2025 Jul 6. In: StatPearls [Internet]. Treasure Island (FL): StatPearls Publishing; 2025 Jan–. 2025 Jul 6. In: StatPearls [Internet]. Treasure Island (FL): StatPearls Publishing; 2025 Jan–. PMID: 30726003 Free Books & Documents.
-
Transfer learning for DL-based Synthetic CT after reconstruction algorithm upgrade in a proton therapy clinic.Med Phys. 2025 Jul;52(7):e17937. doi: 10.1002/mp.17937. Med Phys. 2025. PMID: 40660869 Free PMC article.
-
[Volume and health outcomes: evidence from systematic reviews and from evaluation of Italian hospital data].Epidemiol Prev. 2013 Mar-Jun;37(2-3 Suppl 2):1-100. Epidemiol Prev. 2013. PMID: 23851286 Italian.
-
Falls prevention interventions for community-dwelling older adults: systematic review and meta-analysis of benefits, harms, and patient values and preferences.Syst Rev. 2024 Nov 26;13(1):289. doi: 10.1186/s13643-024-02681-3. Syst Rev. 2024. PMID: 39593159 Free PMC article.
References
-
- Dowling JA, Sun J, Pichler P, et al. Automatic substitute computed tomography generation and contouring for magnetic resonance imaging (MRI)‐alone external beam radiation therapy from standard MRI sequences. Int J Radiat Oncol Biol Phys. 2015;93(5):1144‐1153. doi: 10.1016/j.ijrobp.2015.08.045 - DOI - PubMed
Publication types
MeSH terms
Grants and funding
LinkOut - more resources
Full Text Sources
Medical

