

10-Year Fracture Risk Assessment with Novel Adjustment (FRAXplus): Type 2 Diabetic Sample-Focused Analysis
- PMID: 40804864
- PMCID: PMC12346630
- DOI: 10.3390/diagnostics15151899
10-Year Fracture Risk Assessment with Novel Adjustment (FRAXplus): Type 2 Diabetic Sample-Focused Analysis
Abstract
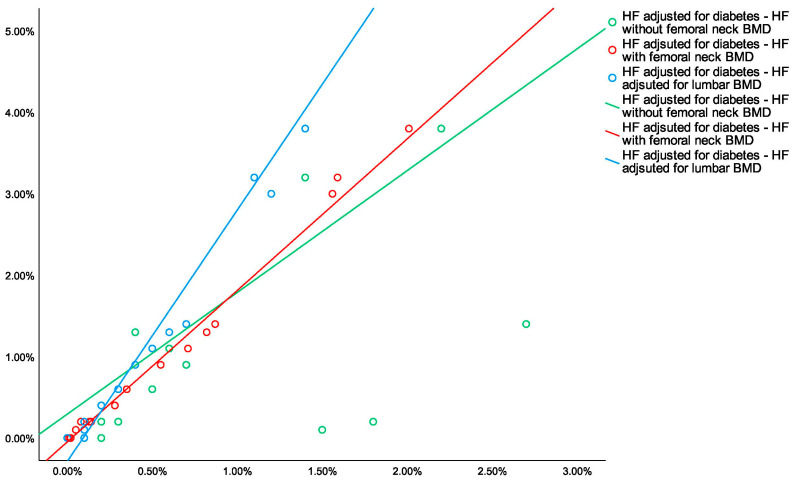
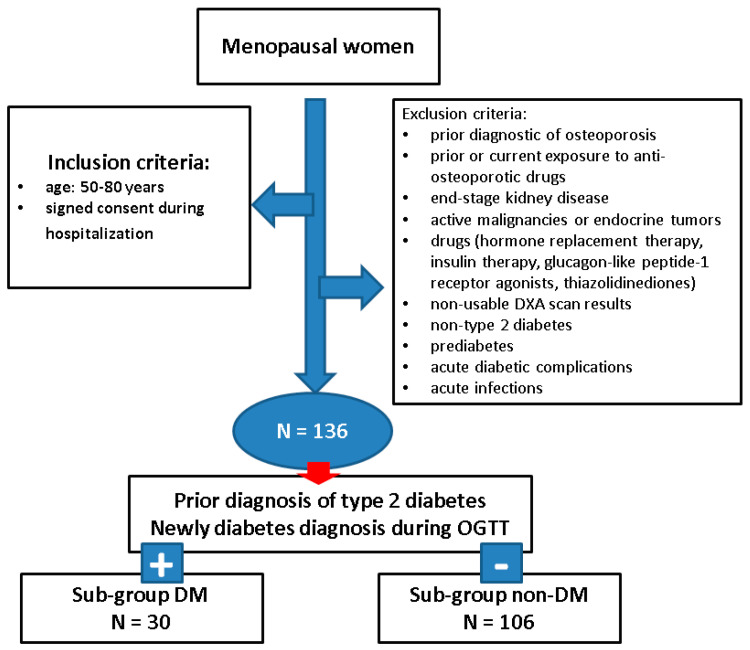
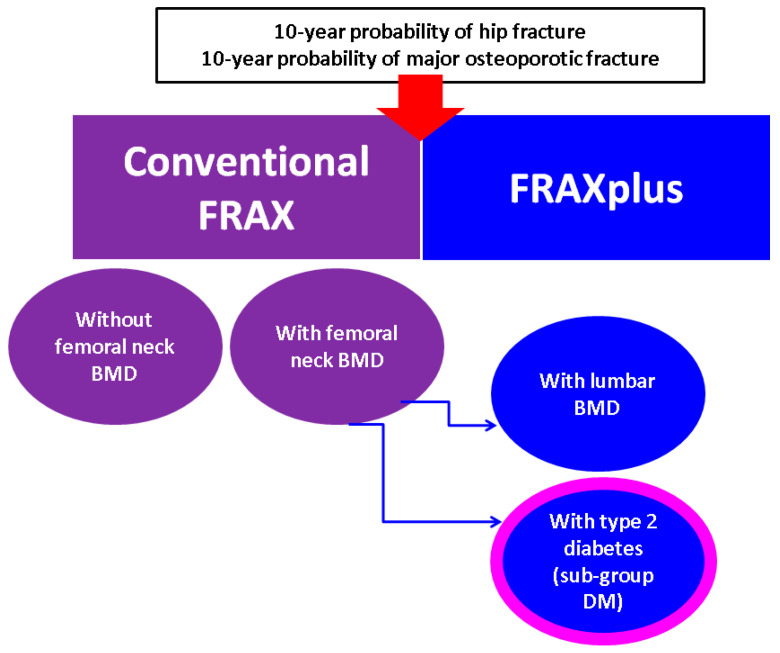
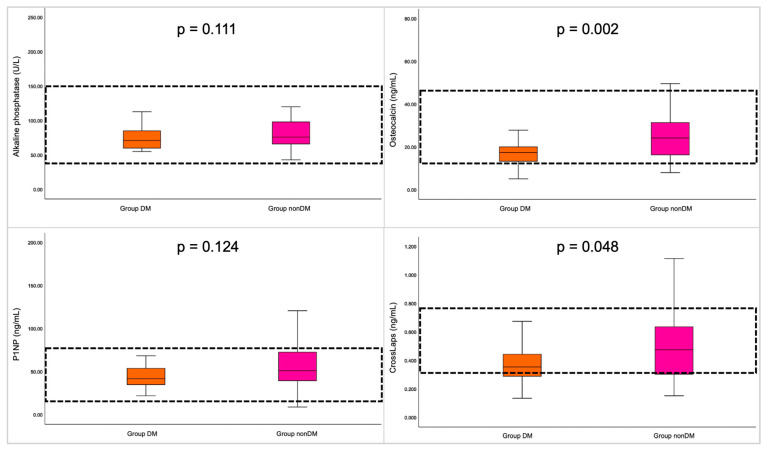
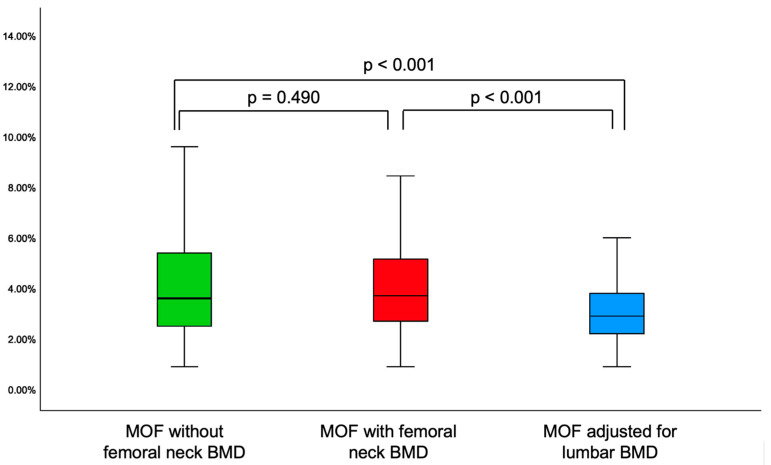
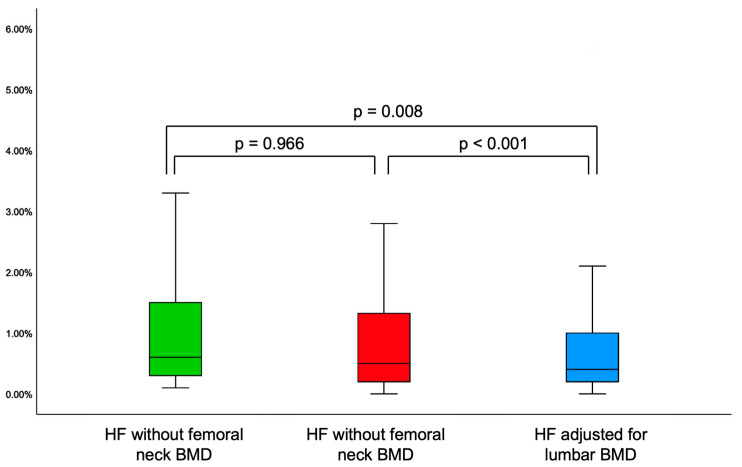
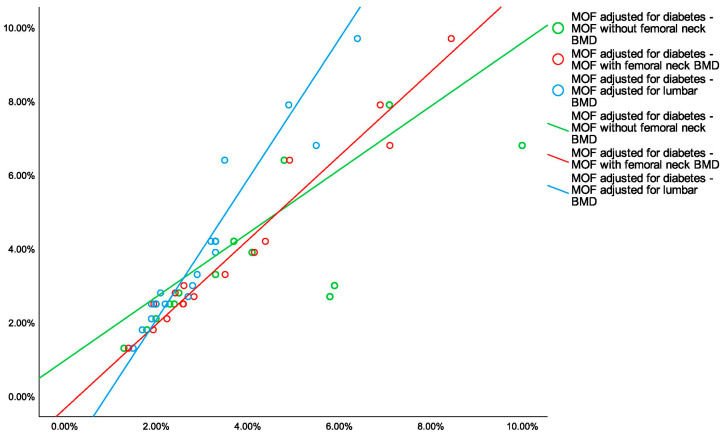
Background: Type 2 diabetes (T2D) has been placed among the risk factors for fragility (osteoporotic) fractures, particularly in menopausal women amid modern clinical practice. Objective: We aimed to analyze the bone status in terms of mineral metabolism assays, blood bone turnover markers (BTM), and bone mineral density (DXA-BMD), respectively, to assess the 10-year fracture probability of major osteoporotic fractures (MOF) and hip fracture (HF) upon using conventional FRAX without/with femoral neck BMD (MOF-FN/HF-FN and MOF+FN/HF+FN) and the novel model (FRAXplus) with adjustments for T2D (MOF+T2D/HF+T2D) and lumbar spine BMD (MOF+LS/HF+LS). Methods: This retrospective, cross-sectional, pilot study, from January 2023 until January 2024, in menopausal women (aged: 50-80 years) with/without T2D (group DM/nonDM). Inclusion criteria (group DM): prior T2D under diet ± oral medication or novel T2D (OGTT diagnostic). Exclusion criteria: previous anti-osteoporotic medication, prediabetes, insulin therapy, non-T2D. Results: The cohort (N = 136; mean age: 61.36 ± 8.2y) included T2D (22.06%). Groups DM vs. non-DM were age- and years since menopause (YSM)-matched; they had a similar osteoporosis rate (16.67% vs. 23.58%) and fracture prevalence (6.66% vs. 9.43%). In T2D, body mass index (BMI) was higher (31.80 ± 5.31 vs. 26.54 ± 4.87 kg/m2; p < 0.001), while osteocalcin and CrossLaps were lower (18.09 ± 8.35 vs. 25.62 ± 12.78 ng/mL, p = 0.002; 0.39 ± 0.18 vs. 0.48 ± 0.22 ng/mL, p = 0.048), as well as 25-hydroxyvitamin D (16.96 ± 6.76 vs. 21.29 ± 9.84, p = 0.013). FN-BMD and TH-BMD were increased in T2D (p = 0.007, p = 0.002). MOF+LS/HF+LS were statistically significant lower than MOF-FN/HF-FN, respectively, MOF+FN/HF+FN (N = 136). In T2D: MOF+T2D was higher (p < 0.05) than MOF-FN, respectively, MOF+FN [median(IQR) of 3.7(2.5, 5.6) vs. 3.4(2.1, 5.8), respectively, 3.1(2.3, 4.39)], but MOF+LS was lower [2.75(1.9, 3.25)]. HF+T2D was higher (p < 0.05) than HF-FN, respectively, HF+FN [0.8(0.2, 2.4) vs. 0.5(0.2, 1.5), respectively, 0.35(0.13, 0.8)] but HF+LS was lower [0.2(0.1, 0.45)]. Conclusion: Type 2 diabetic menopausal women when compared to age- and YSM-match controls had a lower 25OHD and BTM (osteocalcin, CrossLaps), increased TH-BMD and FN-BMD (with loss of significance upon BMI adjustment). When applying novel FRAX model, LS-BMD adjustment showed lower MOF and HF as estimated by the conventional FRAX (in either subgroup or entire cohort) or as found by T2D adjustment using FRAXplus (in diabetic subgroup). To date, all four types of 10-year fracture probabilities displayed a strong correlation, but taking into consideration the presence of T2D, statistically significant higher risks than calculated by the traditional FRAX were found, hence, the current model might underestimate the condition-related fracture risk. Addressing the practical aspects of fracture risk assessment in diabetic menopausal women might improve the bone health and further offers a prompt tailored strategy to reduce the fracture risk, thus, reducing the overall disease burden.
Keywords: 10-year probability of fracture risk; DXA; FRAX; FRAXplus; bone; bone mineral density; diabetes; fracture; fracture risk; menopause; mineral metabolism.
Conflict of interest statement
The authors declare no conflicts of interest.
Figures
Similar articles
-
Geriatric nutritional risk index as a predictor for fragility fracture risk in elderly with type 2 diabetes mellitus: A 9-year ambispective longitudinal cohort study.Clin Nutr. 2024 May;43(5):1125-1135. doi: 10.1016/j.clnu.2024.03.032. Epub 2024 Apr 1. Clin Nutr. 2024. PMID: 38583354
-
Fracture Risk Scores Using Output from an Opportunistic Screen of Low Bone Density from Conventional X-ray.J Bone Miner Res. 2025 Aug 19:zjaf113. doi: 10.1093/jbmr/zjaf113. Online ahead of print. J Bone Miner Res. 2025. PMID: 40827670
-
Effect of FRAXplus adjustments on fracture risk reclassification in older Swedish women-results from the SUPERB-study.Osteoporos Int. 2025 Jul 11. doi: 10.1007/s00198-025-07588-w. Online ahead of print. Osteoporos Int. 2025. PMID: 40643676
-
Glucocorticoid-induced osteoporosis: a systematic review and cost-utility analysis.Health Technol Assess. 2007 Mar;11(7):iii-iv, ix-xi, 1-231. doi: 10.3310/hta11070. Health Technol Assess. 2007. PMID: 17311734
-
Steroidal contraceptives: effect on bone fractures in women.Cochrane Database Syst Rev. 2014 Jun 24;2014(6):CD006033. doi: 10.1002/14651858.CD006033.pub5. Cochrane Database Syst Rev. 2014. PMID: 24960023 Free PMC article.
References
LinkOut - more resources
Full Text Sources
Research Materials
Miscellaneous
