

Beyond Bone Mineral Density: Real-World Fracture Risk Profiles and Therapeutic Gaps in Postmenopausal Osteoporosis
- PMID: 40804936
- PMCID: PMC12346389
- DOI: 10.3390/diagnostics15151972
Beyond Bone Mineral Density: Real-World Fracture Risk Profiles and Therapeutic Gaps in Postmenopausal Osteoporosis
Abstract
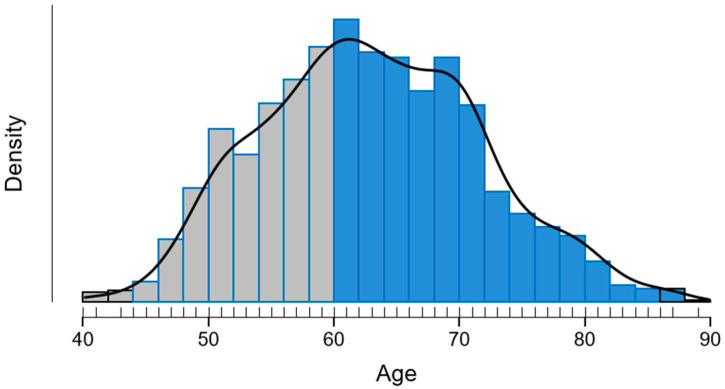
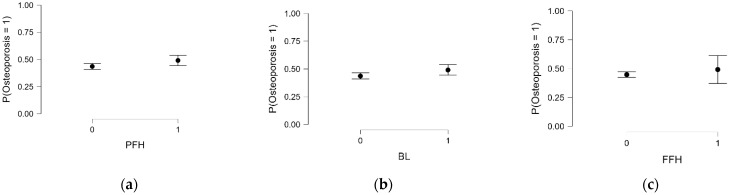
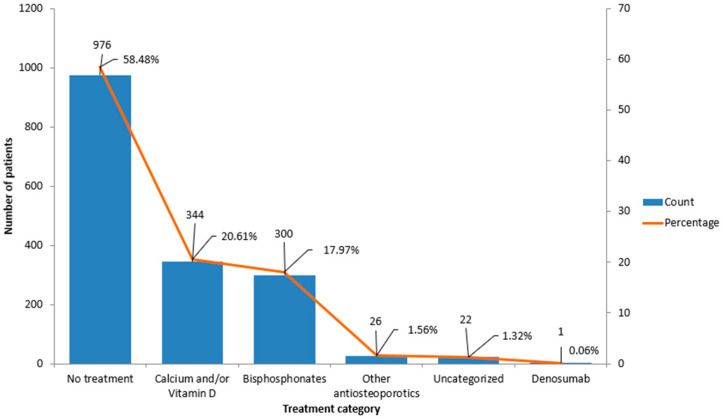
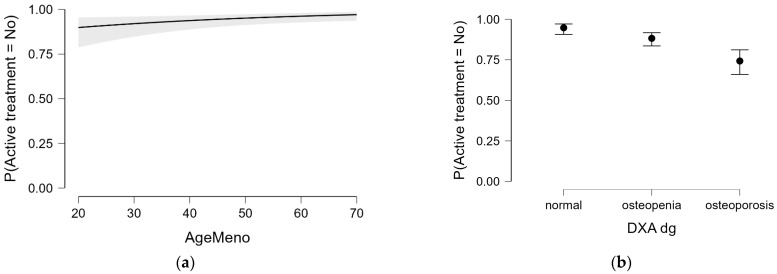
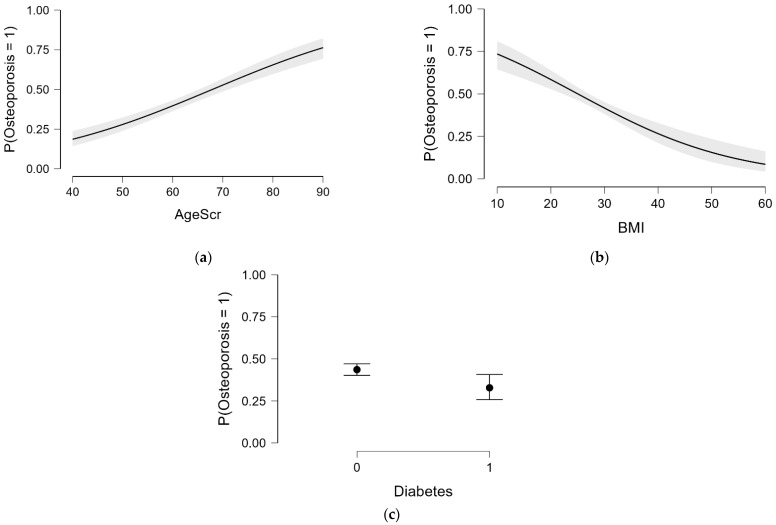
Background/Objectives: Osteoporosis remains a leading cause of morbidity in postmenopausal women, yet many high-risk individuals remain undiagnosed or untreated. This study aimed to assess the prevalence of osteoporosis and osteopenia, treatment patterns, and skeletal fragility indicators in a large cohort of postmenopausal women undergoing DXA screening. Methods: We analyzed data from 1669 postmenopausal women aged 40-89 years who underwent DXA evaluation. BMD status was categorized as normal, osteopenia, or osteoporosis. Treatment status was classified based on active antiosteoporotic therapy, calcium/vitamin D supplementation, hormonal therapy (historical use), or no treatment. Logistic regression models were used to explore independent predictors of osteoporosis and treatment uptake. Results: A total of 45.0% of women had osteoporosis and 43.5% had osteopenia. Despite this, 58.5% of the population, over half of women with osteoporosis, were not receiving any active pharmacologic treatment. Bisphosphonates were the most prescribed therapy (17.9%), followed by calcium/vitamin D supplements (20.6%). A prior history of fragility fractures and radiological bone lesions were significantly associated with lower BMD (p < 0.05). Historical hormone replacement therapy (HRT) use was not associated with current BMD (p = 0.699), but women with HRT use reported significantly fewer fractures (p < 0.001). In multivariate analysis, later menopause age and low BMD status predicted higher odds of receiving active treatment. Conclusions: Our findings highlight a substantial care gap in osteoporosis management, with treatment primarily initiated reactively in more severe cases. Improved screening and earlier intervention strategies are urgently needed to prevent fractures and reduce the long-term burden of osteoporosis.
Keywords: DXA; bone mineral density; fracture risk; postmenopausal osteoporosis; treatment gap.
Conflict of interest statement
The authors declare no conflicts of interest.
Figures
Similar articles
-
Effectiveness and safety of vitamin D in relation to bone health.Evid Rep Technol Assess (Full Rep). 2007 Aug;(158):1-235. Evid Rep Technol Assess (Full Rep). 2007. PMID: 18088161 Free PMC article.
-
A systematic review and economic evaluation of alendronate, etidronate, risedronate, raloxifene and teriparatide for the prevention and treatment of postmenopausal osteoporosis.Health Technol Assess. 2005 Jun;9(22):1-160. doi: 10.3310/hta9220. Health Technol Assess. 2005. PMID: 15929857
-
Glucocorticoid-induced osteoporosis: a systematic review and cost-utility analysis.Health Technol Assess. 2007 Mar;11(7):iii-iv, ix-xi, 1-231. doi: 10.3310/hta11070. Health Technol Assess. 2007. PMID: 17311734
-
Treatment for osteoporosis in people with beta-thalassaemia.Cochrane Database Syst Rev. 2023 May 9;5(5):CD010429. doi: 10.1002/14651858.CD010429.pub3. Cochrane Database Syst Rev. 2023. PMID: 37159055 Free PMC article.
-
Calcium and vitamin D for increasing bone mineral density in premenopausal women.Cochrane Database Syst Rev. 2023 Jan 27;1(1):CD012664. doi: 10.1002/14651858.CD012664.pub2. Cochrane Database Syst Rev. 2023. PMID: 36705288 Free PMC article.
References
-
- Fanelli F., Guglielmi G., Troiano G., Rivara F., Passeri G., Prencipe G., Zhurakivska K., Guglielmi R., Calciolari E. Development of AI-Based Predictive Models for Osteoporosis Diagnosis in Postmenopausal Women from Panoramic Radiographs. J. Clin. Med. 2025;14:4462. doi: 10.3390/jcm14134462. - DOI - PMC - PubMed
-
- Epidemiology of Osteoporosis and Fragility Fractures. [(accessed on 25 March 2025)]. Available online: https://www.osteoporosis.foundation/facts-statistics/epidemiology-of-ost....
LinkOut - more resources
Full Text Sources
Miscellaneous
