. 2025 Jul 31;15(15):2251.
doi: 10.3390/ani15152251.

Assessment of Salivary Biomarkers of Gastric Ulcer in Horses from a Clinical Perspective

Affiliations

Assessment of Salivary Biomarkers of Gastric Ulcer in Horses from a Clinical Perspective

Marta Matas-Quintanilla et al. Animals (Basel). .

Abstract

This study arises from the search for non-invasive diagnostic alternatives for equine gastric ulceration (EGUS), which is prevalent, clinically variable and only confirmed by gastroscopy. The aim is to quantify five salivary biomarkers (IL1-F5, PIP, CA VI, serotransferrin, albumin) under clinical conditions by validated assays and analyse their diagnostic value. Horses were grouped in No EGUS (neither clinical signs of EGUS nor gastric lesions), EGUS non-clinical (apparently no clinical signs of EGUS but with gastric lesions), and EGUS clinical (obvious clinical signs of EGUS and with gastric lesions). The concentration of 5 analytes could be quantified using sandwich ELISA assays, with high precision (CV: 6.79-12.38%) and accuracy (>95%). Mean salivary levels of IL1-F5, CA-VI, serotransferrin and albumin were significantly higher in EGUS clinical horses compared to No EGUS horses, whereas PIP showed no statistical significance. EGUS non-clinical horses showed statistical differences with No EGUS horses for PIP and albumin. In addition, IL1-F5, CA-VI, serotransferrin and albumin showed moderate accuracy to distinguish between No EGUS and EGUS clinical horses (AUC ≥ 0.8), with sensitivity and specificity greater than 77% and 65%, respectively. Therefore, these biomarkers could be a promising starting point for screening horse that might have EGUS in practice.

Keywords: diagnostic value; gastric ulceration; horse; markers; quantification; saliva.


Conflict of interest statement

I.R.I. receives consulting fees from Biozyme Incorporated. L.W. was employed by Biozyme Incorporated. These competing interests do not affect the integrity of the study. M.M.-Q. & A.M.G. are researchers who investigated biomarkers that are subject of patent. C.G.-P. declares no conflicts of interest. The results of this study are protected under US patent application USPTO 63/718,379, owned by Biozyme INC.

Figures

Figure 1
Figure 1
Linear regression lines indicating the accuracy of the assays used for measuring each biomarker in serial dilution of two saliva samples with different concentrations of proteins. The slopes of the regression lines are indicated for each serial dilution. (a) IL1-F5, (b) PIP, (c) CA-VI, (d) serotransferrin, and (e) albumin.
Figure 2
Figure 2
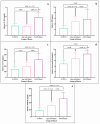
Salivary biomarker concentrations between the different groups of horses: No EGUS (n = 22), EGUS non-clinical (n = 28) and EGUS clinical (n = 28). Mean levels of IL1-F5 (a), PIP (b), CA-VI (c), serotransferrin (d), and albumin (e), where the error bars represent the standard deviation (SD). The p-value is indicated in all comparisons, and the effect size (Cohen d) only when there were statistically significant differences.
Figure 3
Figure 3
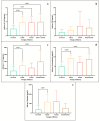
Salivary biomarker concentrations between the different groups of horses: No EGUS (n = 22) and EGUS clinical subdivided into ESGD (n = 9), EGGD (n = 8) and ESGD + EGGD (n = 11). Mean levels of IL1-F5 (a), PIP (b), CA-VI (c), serotransferrin (d), and albumin (e), where the error bars represent the standard deviation (SD). The p-value is indicated when there were statistically significant differences.
Figure 4
Figure 4
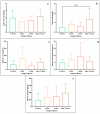
Salivary biomarker concentrations between the different groups of horses: No EGUS (n = 22) and EGUS non-clinical subdivided into ESGD (n = 6), EGGD (n = 11) and ESGD + EGGD (n = 11). Mean levels of IL1-F5 (a), PIP (b), CA-VI (c), serotransferrin (d), and albumin (e), where the error bars represent the standard deviation (SD). The p-value is indicated when there were statistically significant differences.
Figure 5
Figure 5
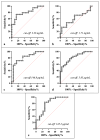
ROC curves and cut-offs of IL1-F5 (a), PIP (b), CA-VI (c), serotransferrin (d), and albumin (e), between the No EGUS horses and the EGUS clinical horses. The x-axis represents the % of specificity, and the y-axis the % of sensitivity. The cut-off points represent the value with the best pair sensitivity-specificity.

Similar articles

References

    1. Sykes B.W., Hewetson M., Hepburn R.J., Luthersson N., Tamzali Y. European College of Equine Internal Medicine Consensus Statement—Equine Gastric Ulcer Syndrome in Adult Horses. J. Vet. Intern. Med. 2015;29:1288–1299. doi: 10.1111/jvim.13578. - DOI - PMC - PubMed
    1. van den Boom R. Equine gastric ulcer syndrome in adult horses. Vet. J. 2022;283–284:105830. doi: 10.1016/j.tvjl.2022.105830. - DOI - PubMed
    1. Lo Feudo C.M., Stucchi L., Conturba B., Stancari G., Zucca E., Ferrucci F. Equine Gastric Ulcer Syndrome affects fitness parameters in poorly performing Standardbred racehorses. Front. Vet. Sci. 2022;9:1014619. doi: 10.3389/fvets.2022.1014619. - DOI - PMC - PubMed
    1. Nadeau J.A., Andrews F.M. Equine gastric ulcer syndrome: The continuing conundrum. Equine Vet. J. 2009;41:611–615. doi: 10.2746/042516409X468056. - DOI - PubMed
    1. Sandin A., Skidell J., Häggström J., Girma K., Nilsson G. Post-mortem findings of gastric ulcers in Swedish horses up to one year of age: A retrospective study 1924–1996. Acta Vet. Scand. 1999;40:109–120. doi: 10.1186/BF03547028. - DOI - PMC - PubMed

LinkOut - more resources