. 2025 Aug 4;15(15):2277.
doi: 10.3390/ani15152277.

Single-Nucleus RNA Sequencing and Spatial Transcriptomics Reveal Cellular Heterogeneity and Intercellular Communication Networks in the Hypothalamus-Pituitary-Ovarian Axis of Pregnant Mongolian Cattle

Affiliations

Single-Nucleus RNA Sequencing and Spatial Transcriptomics Reveal Cellular Heterogeneity and Intercellular Communication Networks in the Hypothalamus-Pituitary-Ovarian Axis of Pregnant Mongolian Cattle

Yanchun Bao et al. Animals (Basel). .

Abstract

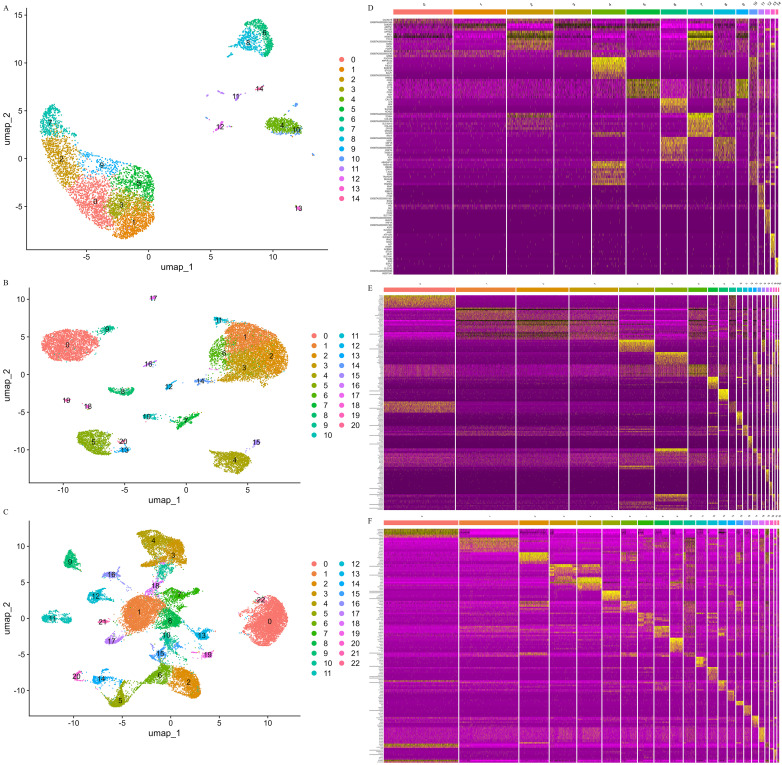
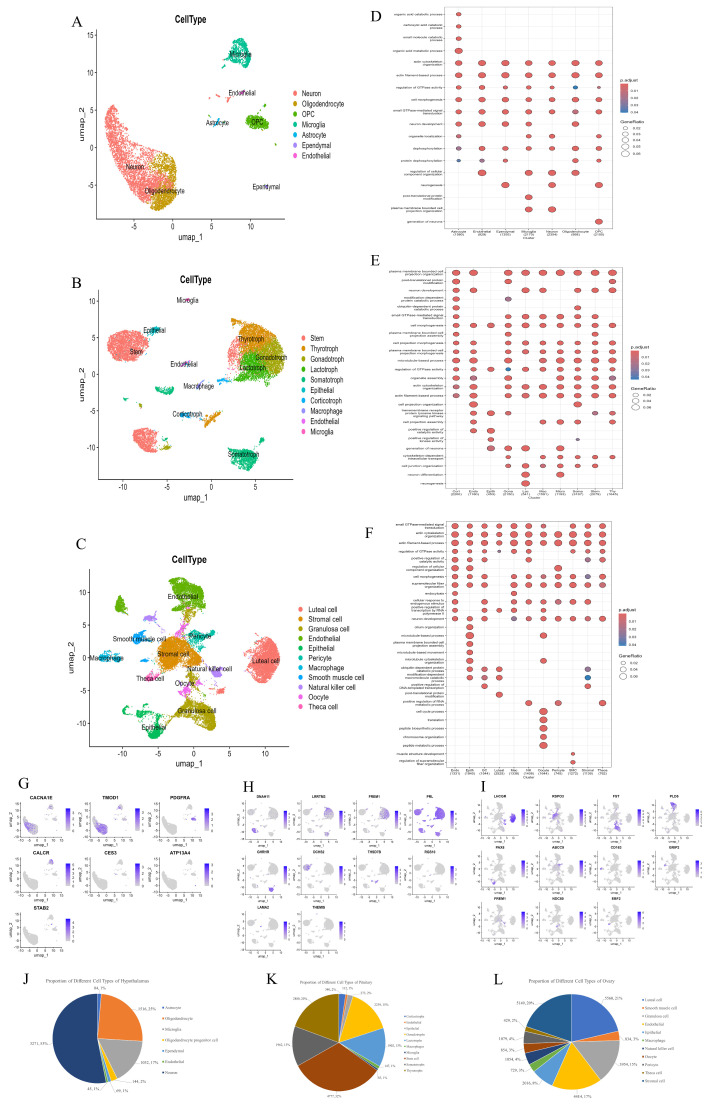
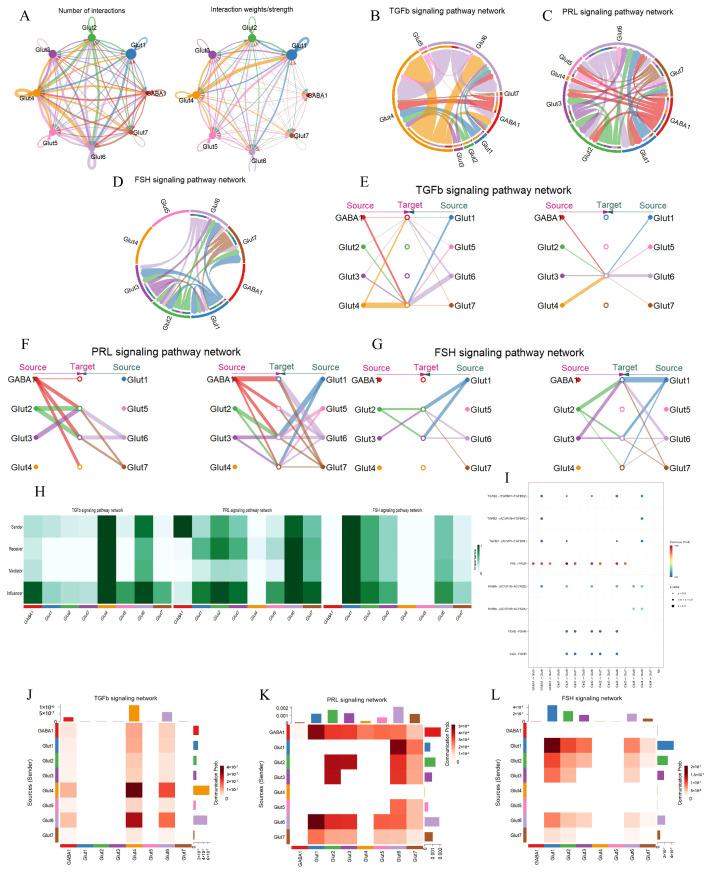
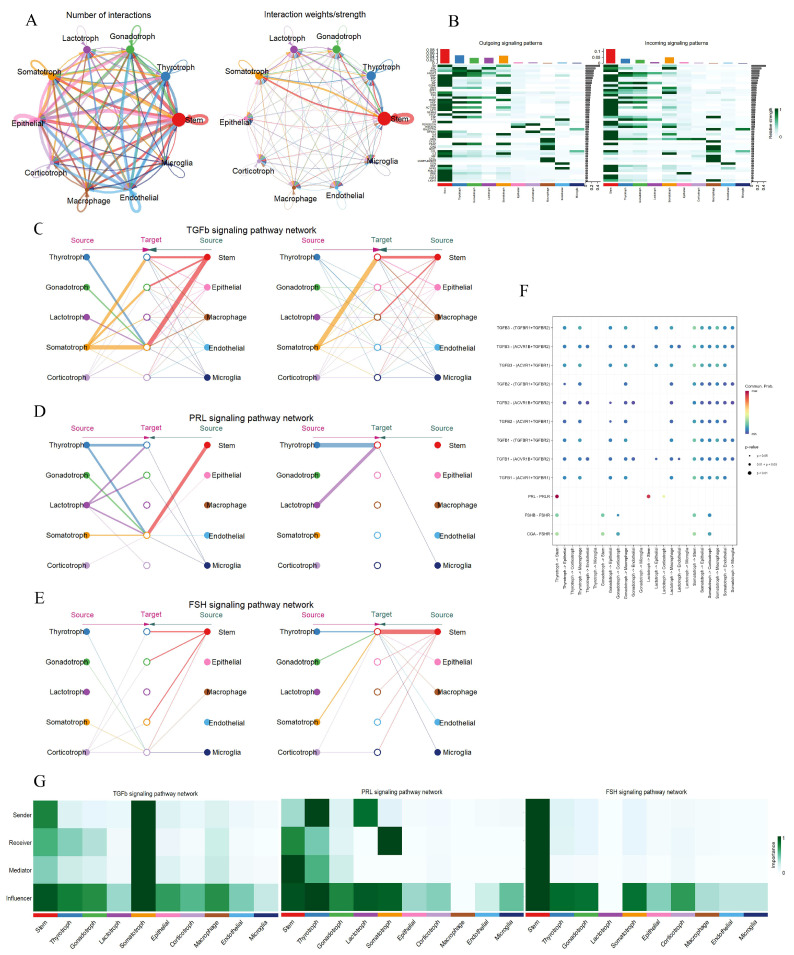
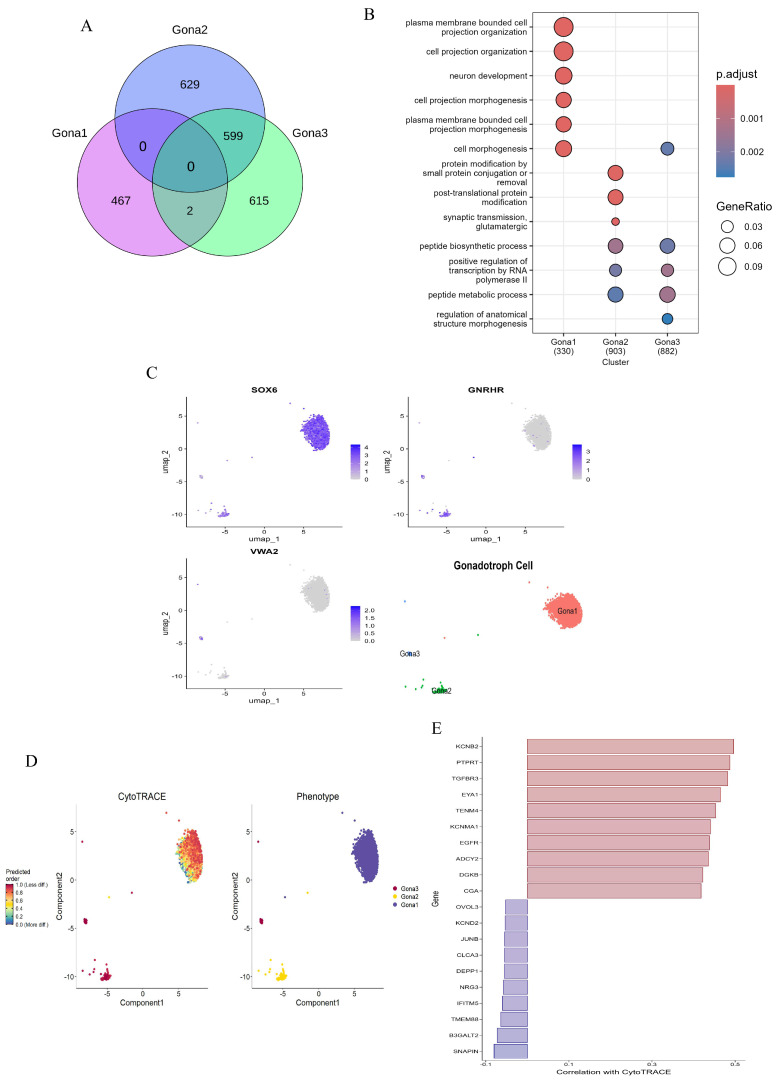
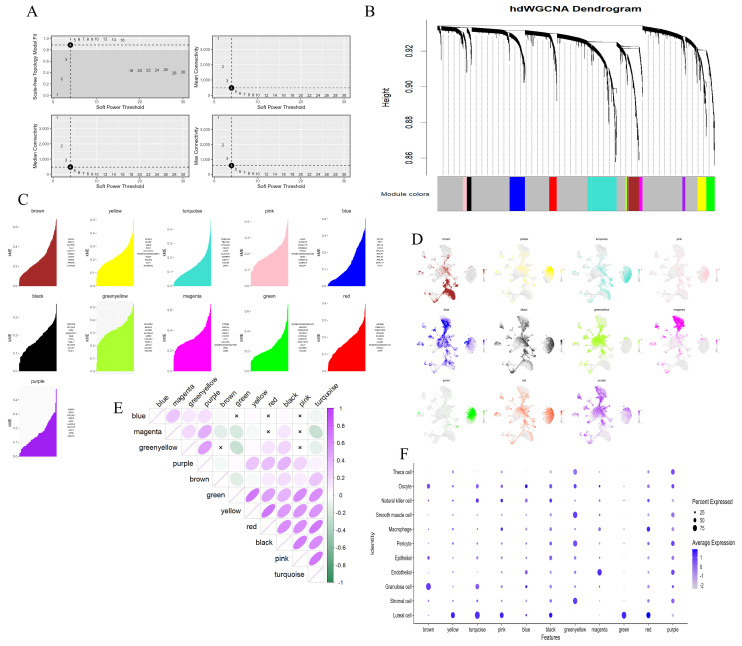
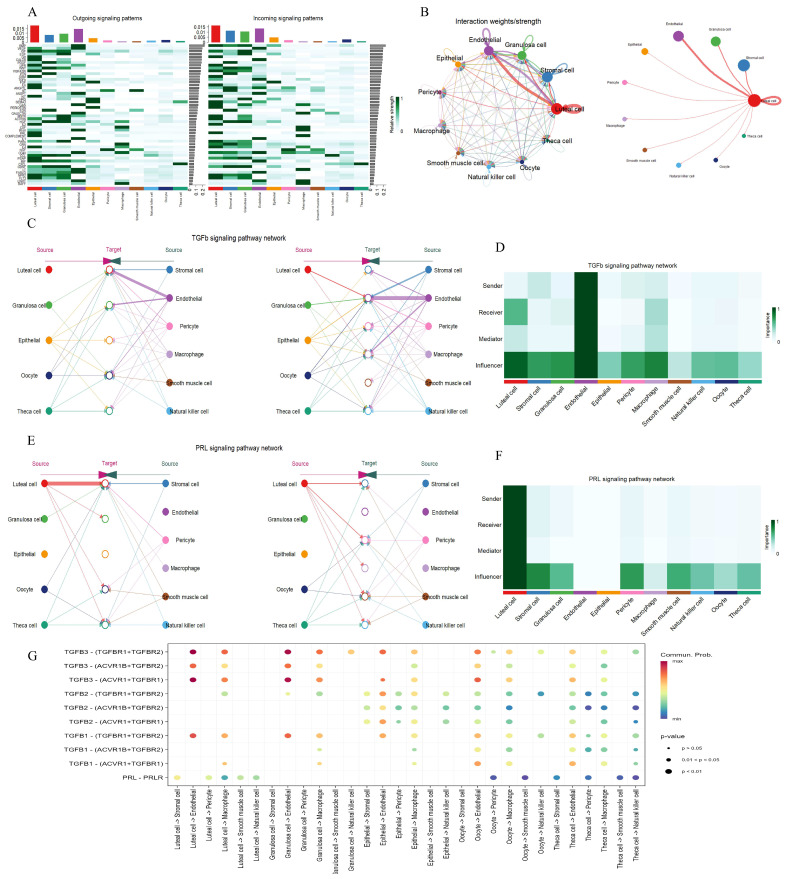
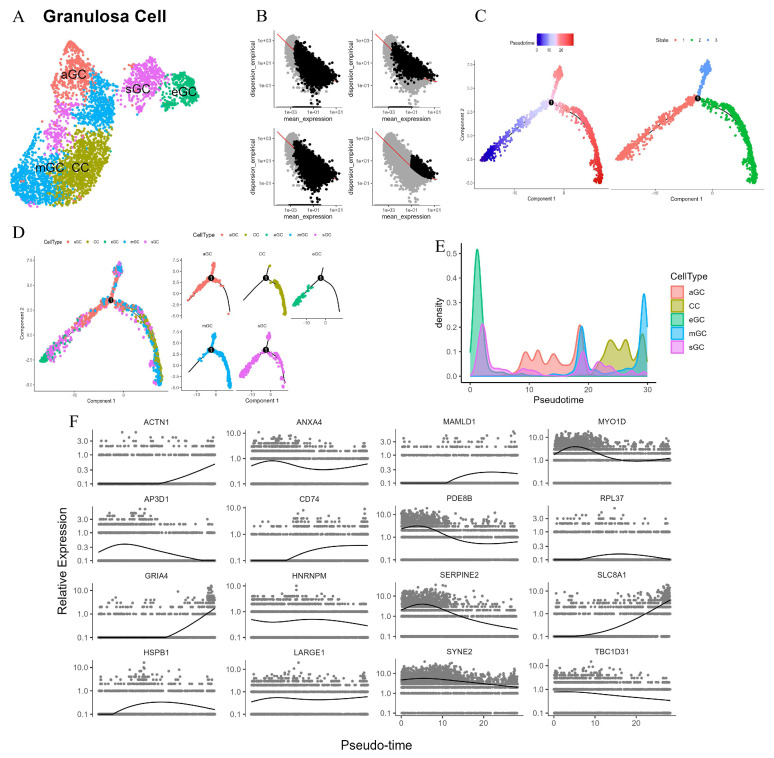
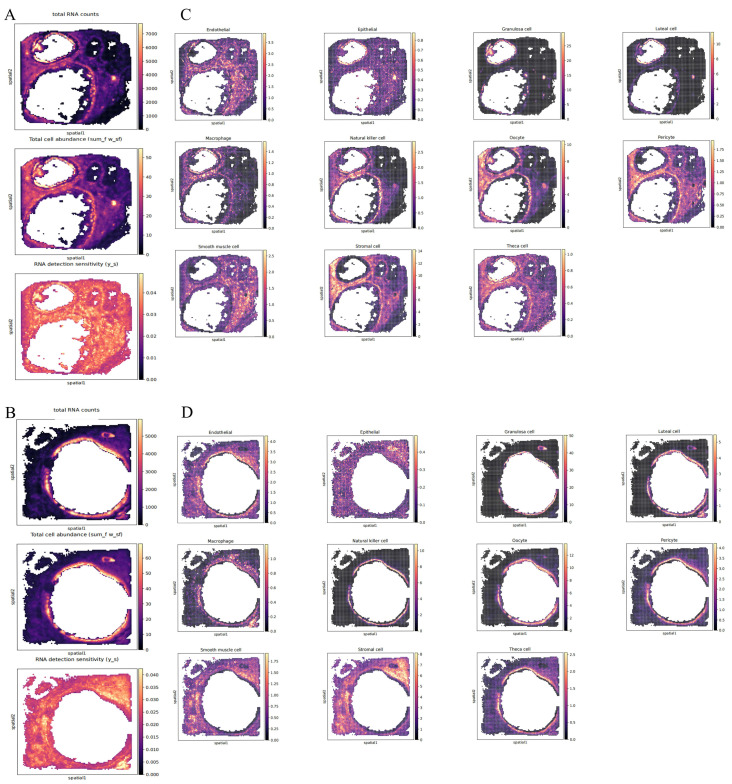
The hypothalamus-pituitary-ovarian (HPO) axis orchestrates reproductive functions through intricate neuroendocrine crosstalk. Here, we integrated single-nucleus RNA sequencing (snRNA-seq) and spatial transcriptomics (ST) to decode the cellular heterogeneity and intercellular communication networks in the reproductive systems of pregnant Mongolian cattle. We retained a total of 6161 high-quality nuclei from the hypothalamus, 14,715 nuclei from the pituitary, and 26,072 nuclei from the ovary, providing a comprehensive cellular atlas across the HPO axis. In the hypothalamus, neurons exhibited synaptic and neuroendocrine specialization, with glutamatergic subtype Glut4 serving as a TGFβ signaling hub to regulate pituitary feedback, while GABAergic GABA1 dominated PRL signaling, likely adapting maternal behavior. Pituitary stem cells dynamically replenished endocrine populations via TGFβ, and lactotrophs formed a PRL-PRLR paracrine network with stem cells, synergizing mammary development. Ovarian luteal cells exhibited steroidogenic specialization and microenvironmental synergy: endothelial cells coregulated TGFβ-driven angiogenesis and immune tolerance, while luteal-stromal PRL-PRLR interactions amplified progesterone synthesis and nutrient support. Granulosa cells (GCs) displayed spatial-functional stratification, with steroidogenic GCs persisting across pseudotime as luteinization precursors, while atretic GCs underwent apoptosis. Spatial mapping revealed GCs' annular follicular distribution, mediating oocyte-somatic crosstalk, and luteal-endothelial colocalization supporting vascularization. This study unveils pregnancy-specific HPO axis regulation, emphasizing multi-organ crosstalk through TGFβ/PRL pathways and stem cell-driven plasticity, offering insights into reproductive homeostasis and pathologies.

Keywords: cattle; hypothalamic–pituitary–ovarian axis; reproductive regulation; single-nucleus RNA sequencing; spatial transcriptomics.


Conflict of interest statement

Author B.L. was employed by the company Inner Mongolia Ben Niu Technology Co., Ltd., Hohhot 010018, China. The remaining authors declare that the research was conducted in the absence of any commercial or financial relationships that could be construed as a potential conflict of interest.

Figures

Figure 1
Figure 1
Clustering and differentially expressed genes of Mongolian cattle HPO axis cells. (AC): UMAP visualization of all cells in the hypothalamus, pituitary and ovary. (DF): Heatmap showing the top 10 DEGs in the hypothalamus, pituitary, and ovary.
Figure 2
Figure 2
Identification of cell types across all HPO axis tissues. (AC): UMAP plots showing various cell types in the hypothalamus, pituitary and ovary. (DF): GO enrichment of DEGs in various cell types in hypothalamus, pituitary, and ovarian tissues. (GI): UMAP analysis revealing gene expression heterogeneity among cell populations in the hypothalamus, pituitary, and ovary. (JL): The proportion of each cell type in the hypothalamus, pituitary, and ovary.
Figure 3
Figure 3
Signaling pathway networks and cellular communication of neuronal subtypes in the hypothalamus. (A): Circle plot illustrating the number of interactions between the various cell types and their weight. The arrows point from the ligand-expressing cells to the receptor-expressing cells, the size of the circles indicates the number of cells, and the width of the lines indicates the number of ligand–receptor pairs. (BD): Chordplots showing the direction and strength of interactions of TGFβ, FSH, and PRL signaling pathways between different cell types in the hypothalamus. (EG): Hierarchical plots showing the intercellular communication network of TGFβ, PRL and FSH signaling pathways. The size of the circle indicates the number of cells, and the width of the line indicates the communication probability. (H): Heatmap showing the relative importance of cell type in TGFβ, FSH, and PRL signaling pathways. Mediator is a compute unit that controls the communication flow between any two compute unit groups. Influencer is a cell that controls the information flow in a signaling network. Importance is the likelihood of the cell type playing the four roles (sender, receiver, mediator, and influencer). A darker color indicates that the cell is playing a bigger role. (I): Bubble plot showing the strength of the interaction of ligand–receptor pairs in cellular communication in the TGFβ, FSH, and PRL signaling pathways. (JL): Heatmaps showing the intensity of cellular communication in the TGFβ, FSH, and PRL signaling pathways.
Figure 4
Figure 4
Signaling pathway networks and cell communication of various cell types within pituitary. (A): Circle plot illustrating the number of interactions between the various cell types and their weight. (B): Identified signaling pathways between all cell types; darker colors indicate a higher degree of cell involvement in the pathway. (CE): Hierarchical plots showing the intercellular communication network of TGFβ, PRL and FSH signaling pathways. (F): Bubble plot showing the strength of the interaction of ligand–receptor pairs in cellular communication in the TGFβ, FSH, and PRL signaling pathways. (G): Heatmap showing the relative importance of cell type in TGFβ, FSH, and PRL signaling pathways.
Figure 5
Figure 5
Molecular characterization of gonadotroph subtypes. (A): Venn diagram showing the intersection of DEGs between the three Gona subtypes and the amount of DEG unique to each subtype. (B): GO enrichment of DEGs of subtype gonadotrophs. (C): Marker genes of three subtypes and UMAP of dimensionality reduction. (D): The differentiation potential of gonadotropin cells was demonstrated by CytoTRACE analysis. The ability to differentiate from less to more is represented by a gradient color from red to blue. (E): Genes associated with differentiation potential are positively correlated in red and negatively correlated in blue.
Figure 6
Figure 6
hdWGCNA identifying key genes involved in the maintenance of pregnancy by luteal cells. (A): The selection of the optimal soft threshold. (B): The coexpression network was constructed based on the ideal “4” soft threshold, and the genes were divided into several modules to obtain the gene clustering tree. The top half is the hierarchical clustering tree of genes and the bottom half is the gene module, which is the network module. (C): Feature-based gene connectivity was calculated for each gene in the coexpression network analysis to identify highly connected genes in each module. (D): The gene score of each module gene was calculated based on UCell algorithm. (E): Correlation between modules based on Pearson correlation analysis. (F): The expression of different cell types in each module is indicated by the size of the dots, with larger dots representing higher expression levels. The color intensity, ranging from light to dark, indicates the proportion of expression.
Figure 7
Figure 7
Signaling pathway networks and cell communication of various cell types within the ovary. (A): Identified signaling pathways between all cell types. (B): Circle plot illustrating the strength of interaction between the various cell types. (C,E): Hierarchical plots showing the intercellular communication network of TGFβ and PRL signaling pathways. (D,F): Heatmap showing the relative importance of cell type in TGFβ and PRL signaling pathways. (G): Bubble plot showing the strength of the interaction of ligand–receptor pairs in cellular communication in the TGFβ and PRL signaling pathways.
Figure 8
Figure 8
Identification of cow subtype granulosa cells in the ovary. (A): Granulosa cell subtype identification in UMAP. (B): Integrating multiple approaches to define cell progression trajectories, differentialGeneTest identifies significant genes (FDR < 0.01) in the top left panel, Seurat selects highly variable genes (HVGs) in the top right panel, cluster-specific differential expression patterns are resolved in the bottom left panel, and Monocle2 reconstructs pseudotemporal trajectories using HVGs in the bottom right panel. (C): Pseudotime trajectory analysis of GCs. (D): The subtypes of GCs distribution in pseudotime and number 1 represents the differentiation node. (E): The density distribution of each subtype GCs in pseudotime series. (F): The expression levels of the 16 genes with the highest degree of variation on the pseudo-temporal timeline.
Figure 9
Figure 9
ST deconvolution of two ovaries from different angles based on snRNA-seq using Cell2location. (A,B): Spatial heatmap illustrating the number of total RNA counts, total cell abundance and RNA detection sensitivity of the ovary from two different angles. (C,D): Spatial heatmap showing the spatial localization based on the abundance of marker genes for the major ovarian cell types identified in snRNA-seq.

Similar articles

References

    1. Fedotova G.V., Slozhenkina M.I., Tsitsige, Natyrov A.K., Erendzhenova M.V. Comparative analysis of economic and biological features of Kalmyk and Mongolian cattle breeds. IOP Conf. Ser. Earth Environ. Sci. 2020;548:082076. doi: 10.1088/1755-1315/548/8/082076. - DOI
    1. Su R., Zhou H., Yang W., Moqir S., Ritu X., Liu L., Shi Y., Dong A., Bayier M., Letu Y., et al. Near telomere-to-telomere genome assembly of Mongolian cattle: Implications for population genetic variation and beef quality. Gigascience. 2024;13 doi: 10.1093/gigascience/giae099. - DOI - PMC - PubMed
    1. Xing Y., Qi Y., Purev C., Wang S., Wang H., Wu K., Cao J., Liu C., Liu Y., Li L., et al. Structural variants in Mongolian originated ruminant: Role in adaptation of extreme-environment. Res. Artic. 2020 doi: 10.21203/rs.3.rs-17431/v1. - DOI
    1. Fukaya S., Yamazaki T., Abe H., Nakagawa S., Baba T., Bai H., Takahashi M., Kawahara M. Characterization of conception rate after embryo transfer in comparison with that after artificial insemination in dairy cattle. J. Dairy Sci. 2024;107:9516–9526. doi: 10.3168/jds.2024-24805. - DOI - PubMed
    1. Reese S.T., Franco G.A., Poole R.K., Hood R., Fernadez Montero L., Oliveira Filho R.V., Cooke R.F., Pohler K.G. Pregnancy loss in beef cattle: A meta-analysis. Anim. Reprod. Sci. 2020;212:106251. doi: 10.1016/j.anireprosci.2019.106251. - DOI - PubMed

LinkOut - more resources