. 2025 Jul 30;17(15):2519.
doi: 10.3390/cancers17152519.

The HIV Protease Inhibitor Ritonavir Reverts the Mesenchymal Phenotype Induced by Inflammatory Cytokines in Normal and Tumor Oral Keratinocytes to an Epithelial One, Increasing the Radiosensitivity of Tumor Oral Keratinocytes

Affiliations

The HIV Protease Inhibitor Ritonavir Reverts the Mesenchymal Phenotype Induced by Inflammatory Cytokines in Normal and Tumor Oral Keratinocytes to an Epithelial One, Increasing the Radiosensitivity of Tumor Oral Keratinocytes

Silvia Pomella et al. Cancers (Basel). .

Abstract

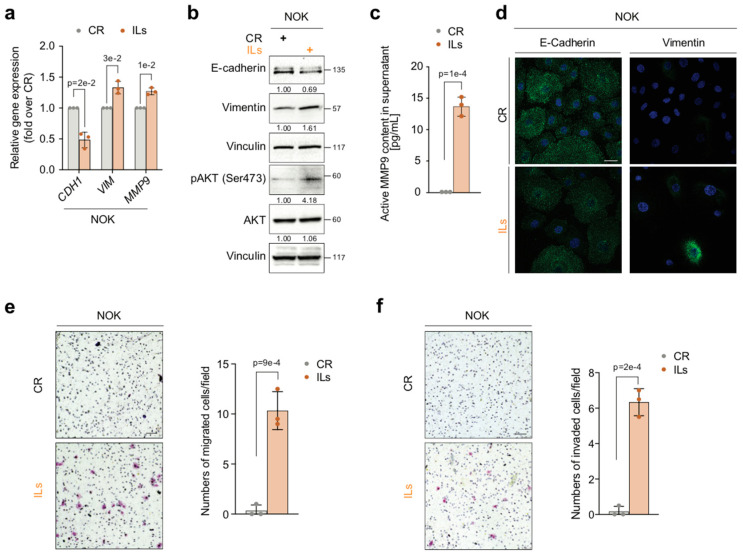
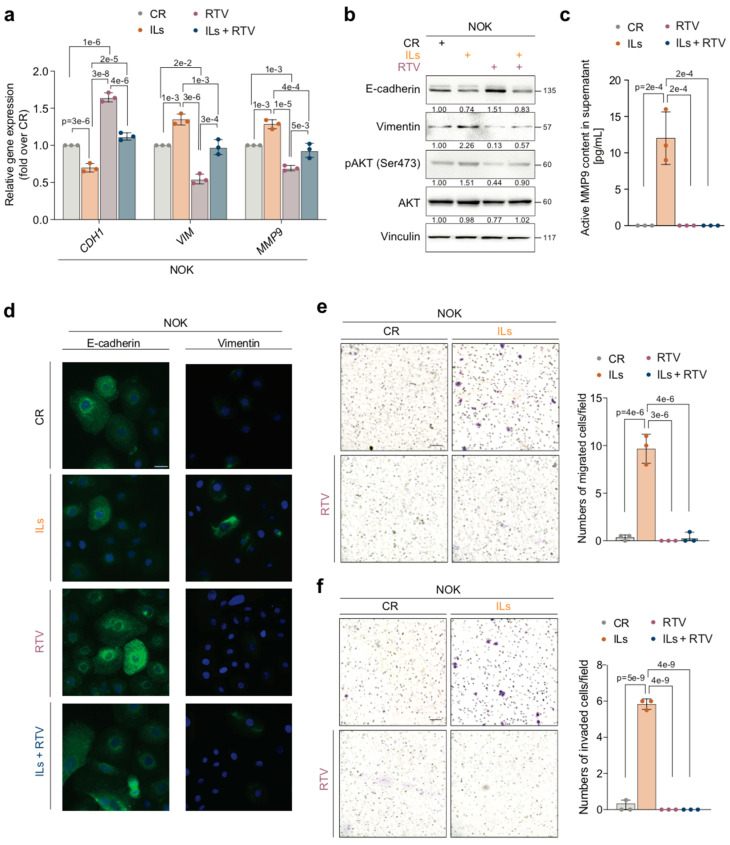
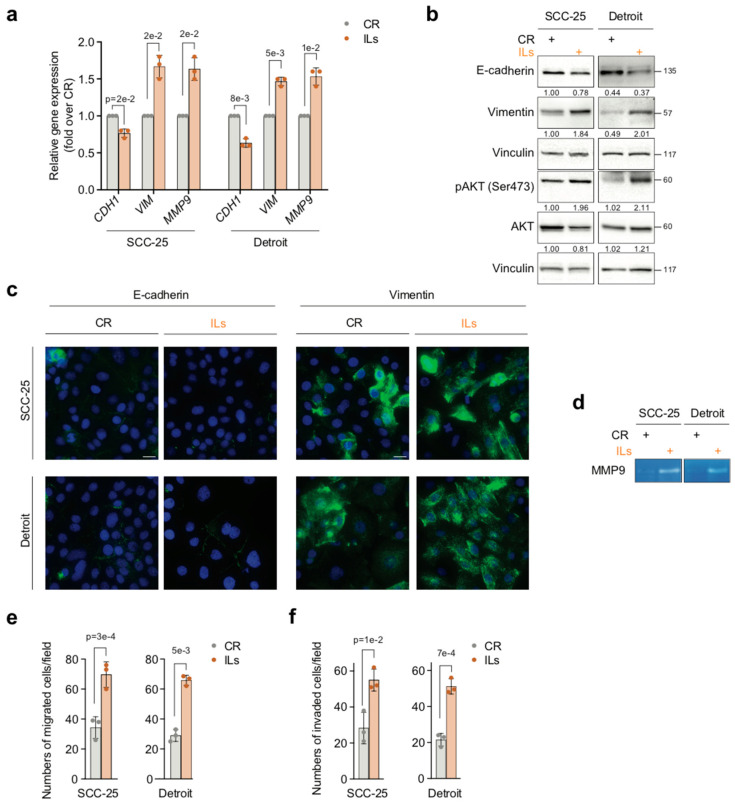
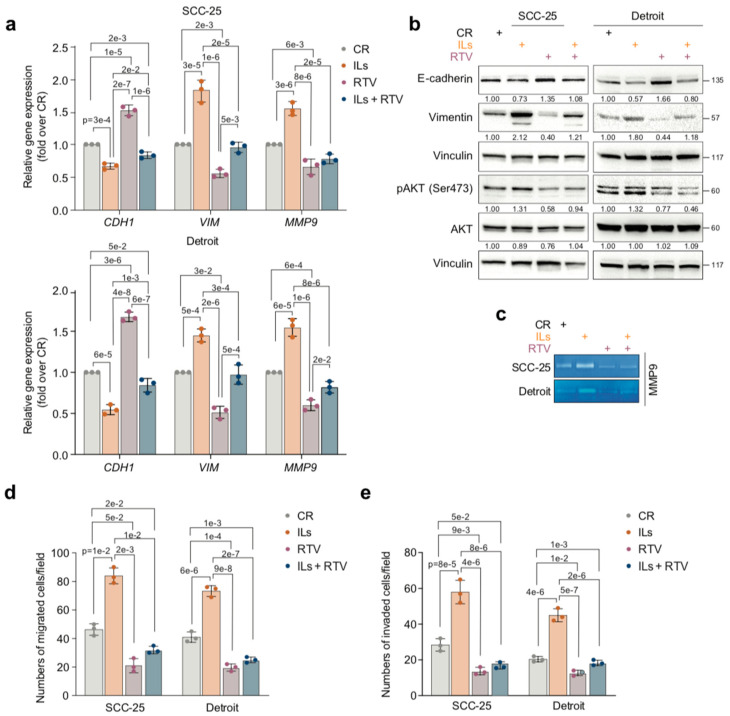
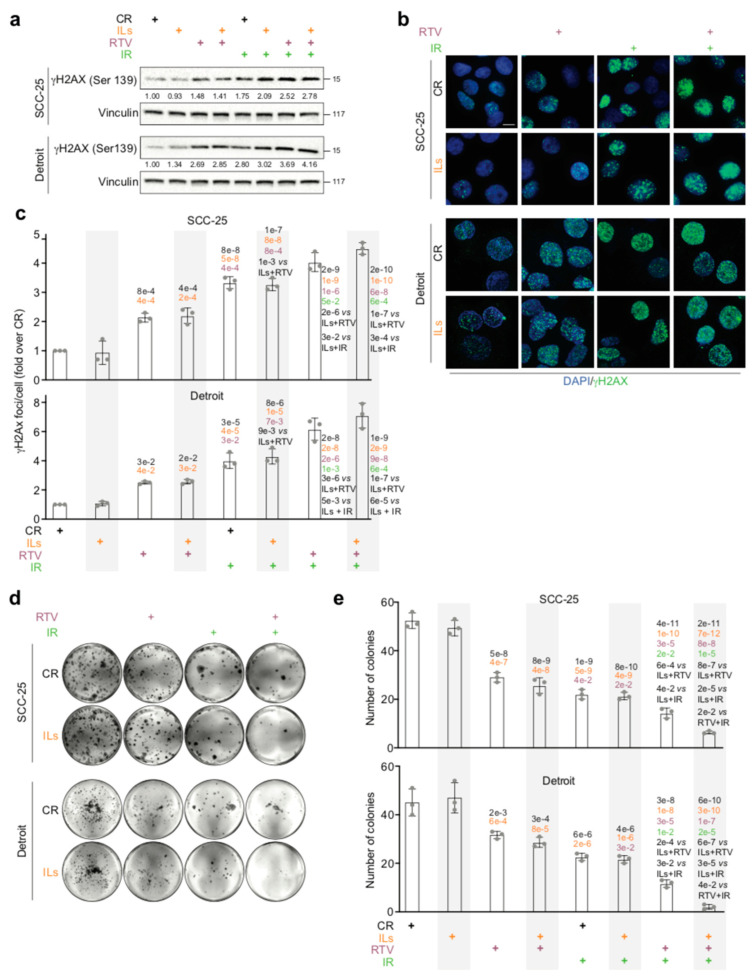
Background/Objectives: During the repair of a wounded epithelium, keratinocytes become invasive via the epithelial-to-mesenchymal transition (EMT) process. Usually temporary and controlled, EMT persists in a chronically inflamed epithelium and is exacerbated in epithelial dysplasia and dysregulated in invasive carcinomas. Here we investigated the effects that IL-1 beta, IL-6, and IL-8, inflammatory cytokines expressed in specimens from OPMDs and OSCCs, have on NOKs and OSCC cells. Methods: AKT activation and EMT induction were assessed along with cellular invasiveness. Results: IL-1 beta, IL-6, and IL-8 induced EMT in NOKs, ex novo conferring them invasive capacity. The same cytokines exacerbated the constitutive EMT and invasiveness of OSCC cells. Since these phenomena were accompanied by AKT activation, we tested whether they could be influenced by RTV, a long-used anti-HIV drug that was previously found to block the activation of human AKT and exert antitumor effects. We observed that therapeutic amounts of RTV counteract all the above-mentioned tumorigenic activities of ILs. Finally, consistent with the key role that AKT and EMT play in OSCC radio-resistance, RTV increased OSCC cells' sensitivity to therapeutic doses of ionizing radiation. Conclusions: These preliminary in vitro findings encourage the use of RTV to prevent the malignant evolution of OPMDs, reduce the risk of OSCC metastasis, and improve the outcomes of anti-OSCC radiotherapy.

Keywords: AKT; EMT; OPMD; OSCC; cell invasion; cell survival; inflammation; interleukins; radiosensitivity; ritonavir.


Conflict of interest statement

The authors declare no conflicts of interest.

Figures

Figure 1
Figure 1
ILs induce mesenchymal traits in NOKs. (a) NOKs were treated for 7 days with either IL-1 beta, IL-6, and IL-8 (ILs) combined at 10 ng/mL each or using IL dilution buffer as the control (CR). The mRNA levels of E-cadherin (CDH1), Vimentin (VIM), and MMP-9 were assayed by RT-qPCR. Gene expression levels were normalized to GAPDH levels and reported as fold increases over the CR (1 arbitrary unit, not reported). Data are presented as mean values  ±  SDs, using Student’s two-tailed t-test (n = 3). (b) Representative Western blot of the indicated proteins in NOKs treated as in (a). Vinculin was the loading control (n = 3). (c) Fluorometric activity assay for active MMP9 in supernatants from NOKs treated as in (a) (n = 3). (d) Representative immunofluorescence of NOKs treated as in (a). E-cadherin or Vimentin expression is shown in green, while nuclei were stained in blue with DAPI. Scale bar  =  25 μm. (n = 3) (e) (left) Representative microscopic images of migration assay of NOKs treated as in (a). Scale bar  =  100 μm. (right) Histograms depict the number of migrated cells. Data presented as mean values  ±  SDs, using Student’s two-tailed t-test. (f) (left) Representative microscopic images of invasion assay of NOKs treated as in (a). Scale bar  =  100 μm. (right) Histograms depict the number of invaded cells. Data presented as mean values  ±  SDs, using Student’s two-tailed t-test (n = 3). Exact p-values are reported in the figure.
Figure 2
Figure 2
RTV reverses IL-induced mesenchymal traits in NOKs. (a) NOKs were treated for 7 days with either IL-1 beta, IL-6, and IL-8 (ILs) combined at 10 ng/mL or with IL dilution buffer each and then exposed for 6 days to 10 μM RTV or its vehicle (DMSO) as a control. The mRNA levels of E-cadherin (CDH1), Vimentin (VIM), and MMP-9 were assayed by RT-qPCR. Gene expression levels were normalized to GAPDH levels and reported as fold increases over the CR (1 arbitrary unit, not reported). Data are presented as mean values  ±  SDs, using one-way ANOVA (n = 3). (b) Representative Western blot of the indicated proteins in NOKs treated as in (a). Vinculin was the loading control (n = 3). (c) Fluorometric activity assay for active MMP9 in supernatants from NOKs treated as in (a) (n = 3). (d) Representative immunofluorescence of NOKs treated as in (a). E-cadherin or Vimentin expression is shown in green, while nuclei were stained in blue with DAPI. Scale bar  =  25 μm. (n = 3) (e) (left) Representative microscopic images of migration assay of NOKs treated as in (a). Scale bar  =  100 μm. (right) Histograms depict the number of migrated cells. Data are presented as mean values  ±  SDs, using one-way ANOVA (n = 3). (f) (left) Representative microscopic images of invasion assay of NOKs treated as in (a). Scale bar  =  100 μm. (right) Histograms depict the number of invaded cells. Data are presented as mean values  ±  SDs, using one-way ANOVA (n = 3). Exact p-values are reported in the Figure.
Figure 3
Figure 3
ILs enhance EMT-associated invasiveness in OSCC cells. (a) SCC-25 and Detroit cells were treated for 7 days with either IL-1 beta, IL-6, and IL-8 (ILs) combined at 10 ng/mL each or with IL dilution buffer as the control (CR). The mRNA levels of E-cadherin (CDH1), Vimentin (VIM), and MMP-9 were assayed by RT-qPCR. Gene expression levels were normalized to GAPDH levels and reported as fold increases over the CR (1 arbitrary unit, not reported). Data are presented as mean values  ±  SDs, using the Student’s two-tailed t-test (n = 3). (b) Representative Western blot of the indicated proteins in SCC-25 and Detroit cells treated as in (a). Vinculin was the loading control (n = 3). (c) Representative immunofluorescence of SCC-25 and Detroit cells treated as in (a). E-cadherin or Vimentin expression is shown in green, while nuclei were stained in blue with DAPI. Scale bar  =  25 μm. (n = 3) (d) Representative gelatin zymography of supernatant of SCC-25 and Detroit cells treated as in (a) (n = 3). (e) Histograms depict the number of migrated SCC-25 cells and Detroit cells treated as in (a). Data are presented as mean values  ±  SDs, using the Student’s two-tailed t-test (n = 3). (f), Histograms depict the number of invaded SCC-25 cells and Detroit cells treated as in (a). Data are presented as mean values  ±  SDs, using the Student’s two-tailed t-test (n = 3). Exact p-values are reported in the Figure.
Figure 4
Figure 4
RTV inhibits constitutive tumorigenic and mesenchymal properties and counteracts IL-exacerbated ones in OSCC cells. (a) SCC-25 cells and Detroit cells were treated for 7 days with either IL-1 beta, IL-6, and IL-8 (ILs) combined at 10 ng/mL each or with IL dilution buffer and then exposed for 6 days to either 10 μM RTV or its vehicle (DMSO) as a control. The mRNA levels of E-cadherin (CDH1), Vimentin (VIM), and MMP-9 were assayed by RT-qPCR. Gene expression levels were normalized to GAPDH levels and reported as fold increases over the control (1 arbitrary unit, not reported). Data are presented as mean values  ±  SDs, using one-way ANOVA (n = 3). (b) Representative Western blot of the indicated proteins in SCC-25 and Detroit cells treated as in (a). Vinculin was the loading control (n = 3). (c) Representative gelatin zymography of supernatant of SCC-25 and Detroit cells treated as in (a) (n = 3). (d) Histograms depict the number of migrated SCC-25 cells and Detroit cells treated as in (a). Data are presented as mean values  ±  SDs, using one-way ANOVA (n = 3). (e) Histograms depict the number of invaded SCC-25 cells and Detroit cells treated as in (a). Data are presented as mean values  ±  SDs, using one-way ANOVA (n = 3). Exact p-values are reported in the Figure.
Figure 5
Figure 5
RTV sensitizes OSCC cells to IR. (a) SCC-25 cells and Detroit cells were treated for 7 days with either IL-1 beta, IL-6, and IL-8 (ILs) combined at 10 ng/mL each or with IL dilution buffer and then exposed for 6 days to either 10 μM RTV or its vehicle (DMSO) as the control. Cells were then irradiated (4 Gy) and processed 6 h later. Representative Western blot of gamma of the indicated proteins in SCC-25 and Detroit cells treated as in (a). Vinculin was the loading control (n = 3). (b) Representative immunofluorescence of SCC-25 cells and Detroit cells treated as in (a), showing gamma H2AX (Ser139) (green). Nuclei were stained with DAPI (blue). Scale bar  =  10 μm. (c) Histograms depict the number of gamma H2AX (Ser139) foci per cell in SCC-25 (top) and Detroit (bottom) cells treated as in (a). Results were expressed as fold increases over control values. Data are presented as mean values  ±  SDs, using one-way ANOVA (n = 3). Black p-values (treatment vs. control); yellow p-values (treatment vs. ILs); purple p-values (treatment vs. RTV); green p-values (treatment vs. IR). (d) Representative images of colony formation assay of SCC-25 (top) and Detroit (bottom). (e) Histograms depict the number of colonies of SCC-25 (top) and Detroit (bottom) cells treated as in (a). Data are presented as mean values  ±  SDs, using one-way ANOVA (n = 3). Black p-values (treatment vs. control); yellow p-values (treatment vs. ILs); purple p-values (treatment vs. RTV); green p-values (treatment vs. IR).

Similar articles

References

    1. Pomella S., Melaiu O., Cifaldi L., Bei R., Gargari M., Campanella V., Barillari G. Biomarkers Identification in the Microenvironment of Oral Squamous Cell Carcinoma: A Systematic Review of Proteomic Studies. Int. J. Mol. Sci. 2024;25:8929. doi: 10.3390/ijms25168929. - DOI - PMC - PubMed
    1. Pomella S., Melaiu O., Dri M., Martelli M., Gargari M., Barillari G. Effects of Angiogenic Factors on the Epithelial-to-Mesenchymal Transition and Their Impact on the Onset and Progression of Oral Squamous Cell Carcinoma: An Overview. Cells. 2024;13:1294. doi: 10.3390/cells13151294. - DOI - PMC - PubMed
    1. Haensel D., Dai X. Epithelial-to-Mesenchymal Transition in Cutaneous Wound Healing: Where We Are and Where We Are Heading. Dev. Dyn. 2018;247:473–480. doi: 10.1002/dvdy.24561. - DOI - PMC - PubMed
    1. Lamouille S., Xu J., Derynck R. Molecular Mechanisms of Epithelial-Mesenchymal Transition. Nat. Rev. Mol. Cell Biol. 2014;15:178–196. doi: 10.1038/nrm3758. - DOI - PMC - PubMed
    1. Masola V., Carraro A., Granata S., Signorini L., Bellin G., Violi P., Lupo A., Tedeschi U., Onisto M., Gambaro G., et al. In Vitro Effects of Interleukin (IL)-1 Beta Inhibition on the Epithelial-to-Mesenchymal Transition (EMT) of Renal Tubular and Hepatic Stellate Cells. J. Transl. Med. 2019;17:12. doi: 10.1186/s12967-019-1770-1. - DOI - PMC - PubMed

LinkOut - more resources