. 2025 Aug 1;17(15):2554.
doi: 10.3390/cancers17152554.

YAP/TAZ Promote GLUT1 Expression and Are Associated with Prognosis in Endometrial Cancer

Affiliations

YAP/TAZ Promote GLUT1 Expression and Are Associated with Prognosis in Endometrial Cancer

Masayuki Fujita et al. Cancers (Basel). .

Abstract

Background/Objectives: Yes-associated protein (YAP) and transcriptional coactivator with PDZ-binding motif (TAZ) function as effectors in the Hippo pathway and have attracted attention due to their association with tumor formation. Glucose transporter (GLUT) proteins also contribute to the proliferation of cancer cells. In this study, we investigated the effect of YAP/TAZ on GLUT1 expression in endometrial carcinoma, as well as the clinical relevance and prognostic value of YAP/TAZ. Methods: The effects of YAP and TAZ knockdown and YAP overexpression on GLUT1 expression in human endometrial carcinoma-derived HHUA and Ishikawa cells were evaluated using RT-qPCR. In addition, we performed immunohistochemical expression of 100 tissue samples of diagnosed endometrial carcinoma. Based on staining intensity and the percentage of positively stained tumor cells, the immunoreactivity score was calculated, which ranged from 0 to 12. Results: YAP/TAZ were identified as important factors in the regulation of GLUT1 expression in HHUA and Ishikawa cells. In addition, a significant correlation (progression-free survival p < 0.05) was observed between TAZ and GLUT1 expression in tissues from endometrial carcinoma patients, and nuclear expression of TAZ was associated with poor prognosis (p < 0.05). Conclusions: YAP/TAZ promote tumor growth via GLUT1. Therapeutic targeting of YAP/TAZ could therefore be useful in the development of future treatments.

Keywords: GLUT1; TAZ; YAP; endometrial cancer; hippo pathway.


Conflict of interest statement

The authors declare no conflicts of interest.

Figures

Figure 1
Figure 1
Representative sections of endometrial cancer tissue showing immunostaining for YAP (a,b,g,h), TAZ (c,d,i,j), and GLUT1 (e,f,k,l) (upper) and respective negative or weak staining (bottom) ((a,c,e,g,i,j): magnification ×100; (b,d,f,h,j,l): magnification ×200). Scale bar = 50 μm.
Figure 2
Figure 2
YAP and TAZ are regulators of GLUT1 (encoded by SLC2A1) expression in HHUA and Ishikawa cells. HHUA and Ishikawa cells were transfected with either of two independent siRNAs (YAP (Y1, Y2), TAZ (T1, T2), YAP/TAZ (YT1, YT2); 20 nM) or a non-targeting control (NC) (20 nM) siRNA. At 48 h after transfection, the respective effect of knockdown on the expression of SLC2A1, CYR61, YAP, and TAZ in HHUA and Ishikawa cells was analyzed. mRNA levels were measured by RT-qPCR and normalized relative to 36B4 mRNA. The ratio of the NC was arbitrarily defined as 1. Data are the mean ± SEM of three independent experiments. Statistical analysis was performed using the Sidak multiple comparison method (ns p > 0.05, ** p ≤ 0.01, *** p ≤ 0.001, **** p ≤ 0.0001).
Figure 3
Figure 3
Introduction of constitutively active YAP induces GLUT1 (encoded by SLC2A1) expression in HHUA and Ishikawa cells. HHUA and Ishikawa cells were infected with adenovirus at the indicated multiplicity of infection (MOI), corresponding to the number of virus particles per cell. To combine siRNA knockdown and adenovirus-mediated transduction, adenovirus infection was performed 4 h after cells were transfected with TAZ (T1) siRNA (20 nM) or non-targeting control (NC) (20 nM) siRNA, and the cells were then cultured for an additional 48 h. The effect of YAP-5SA on the expression of SLC2A1, CYR61, YAP, and TAZ in HHUA and Ishikawa cells was then analyzed. mRNA levels were measured by RT-qPCR and normalized relative to 36B4 mRNA. The ratio of NC was arbitrarily defined as 1. Data are the mean ± SEM of three independent experiments. Statistical analysis was performed using the Sidak multiple comparison test (ns p > 0.05, * p ≤ 0.05, ** p ≤ 0.01, *** p ≤ 0.001, **** p ≤ 0.0001).
Figure 4
Figure 4
Correlation between YAP nuclear expression and GLUT1 (a) and TAZ nuclear expression and GLUT1 (b). Each point in the figure represents the IRS (n = 100) of each protein from clinical specimen tissues obtained from endometrial cancer patients (duplicates included).
Figure 5
Figure 5
ROC curves for predicting PFS (af) based on IRS for nuclear YAP, cytoplasmic YAP, nuclear TAZ, cytoplasmic TAZ, YAP nuclear expression minus cytoplasmic expression (N-C), and TAZ N-C. The parentheses in the figure indicate (specificity, sensitivity). (* p < 0.05) (a) AUC = 0.644 (p = 0.120, 95% confidence interval (CI) 0.48–0.808), with an optimal cutoff value of 3.5 for nuclear YAP; (b) AUC = 0.594 (p = 0.308, 95% CI 0.391–0.798), with an optimal cutoff value of 5 for cytoplasmic YAP; (c) AUC = 0.563 (p = 0.498, 95% CI 0.340–0.786), with an optimal cutoff value of 0.5 for nuclear TAZ; (d) AUC = 0.635 (p = 0.144, 95% CI 0.447–0.824), with an optimal cutoff value of 1.5 for cytoplasmic TAZ; (e) AUC = 0.502 (p = 0.987, 95% CI 0.275–0.728), with an optimal cutoff value of 0 for YAP N-C; (f) AUC = 0.692 (p = 0.039, 95% CI 0.518–0.865), with an optimal cutoff value of −0.5 for TAZ N-C.
Figure 6
Figure 6
ROC curves for predicting OS (af) based on IRS for nuclear YAP, cytoplasmic YAP, nuclear TAZ, cytoplasmic TAZ, YAP nuclear expression minus cytoplasmic expression (N-C), and TAZ N-C. The parentheses in the figure indicate (specificity, sensitivity). (a) AUC = 0.629 (p = 0.331, 95% CI 0.351–0.908), with an optimal cutoff value of 3.5 for nuclear YAP; (b) AUC = 0.585 (p = 0.552, 95% CI 0.218–0.952), with an optimal cutoff value of 4 for cytoplasmic YAP; (c) AUC = 0.675 (p = 0.189, 95% CI 0.313–1.000), with an optimal cutoff value of 1.5 for nuclear TAZ; (d) AUC = 0.751 (p = 0.060, 95% CI 0.532–0.969), with an optimal cutoff value of 6 for cytoplasmic TAZ; (e) AUC = 0.523 (p = 0.862, 95% CI 0.172–0.875), with an optimal cutoff value of −3 for YAP N-C; (f) AUC = 0.705 (p = 0.123, 95% CI 0.401–1.00), with an optimal cutoff value of 0 for TAZ N-C.
Figure 7
Figure 7
Kaplan–Meier survival curves for PFS (af) of patients with uterine carcinoma, according to the IRS for nuclear YAP, cytoplasmic YAP, nuclear TAZ, cytoplasmic TAZ, YAP N-C, and TAZ N-C. (* p < 0.05) (a) PFS of patients with low (≤3.5, solid line) and high (>3.5, dotted line) nuclear YAP IRS. (b) PFS of patients with low cytoplasmic YAP IRS (≤5, solid line) and high cytoplasmic YAP IRS (>5, dotted line). (c) PFS of patients with low TAZ nuclear (≤0.5, solid line) and high TAZ nuclear IRS (>0.5, dotted line). Patients with low TAZ nuclear IRS had poorer PFS than those with high TAZ nuclear IRS (p < 0.0001). (d) PFS of patients with low cytoplasmic TAZ IRS (≤1.5, solid line) and high cytoplasmic TAZ IRS (>1.5, dotted line). Patients with low cytoplasmic TAZ IRS had poorer PFS than those with high cytoplasmic TAZ IRS (p = 0.0062). (e) PFS of patients with high (≥0, solid line) and low (≤0, dotted line) YAP N-C IRS. (f) PFS of patients with high (≥−0.5, solid line) and low (≤−0.5, dotted line) TAZ N-C IRS. Patients with high TAZ N-C IRS had poorer PFS than those with low TAZ N-C IRS (p = 0.01).
Figure 8
Figure 8
Kaplan–Meier survival curves for OS (af) of patients with uterine carcinoma, according to the IRS for nuclear YAP, cytoplasmic YAP, nuclear TAZ, cytoplasmic TAZ, YAP N-C, and TAZ N-C. (* p < 0.05) (a) OS of patients with low (≤3.5, solid line) and high (≥3.5, dotted line) nuclear YAP IRS. (b) OS of patients with low (≤4, solid line) and high (≥4, dotted line) cytoplasmic YAP IRS. (c) OS of patients with low nuclear TAZ IRS (≤1.5, solid line) and high nuclear TAZ IRS (>1.5, dotted line). Patients with low nuclear TAZ IRS had poorer OS than those with high nuclear TAZ IRS (p = 0.0075). (d) OS of patients with low (≤6, solid line) and high (>6, dotted line) cytoplasmic TAZ IRS. (e) OS of patients with low (≤−3, solid line) and high (>−3, dotted line) YAP N-C IRS. (f) OS of patients with high (>0, solid line) and low (≤0, dotted line) TAZ N-C IRS.
Figure 9
Figure 9
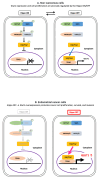
A schematic model of Hippo pathway regulation in non-cancerous and endometrioid cancer cells. Upper panel: In non-cancerous cells, the Hippo pathway regulates the dynamic subcellular localization of YAP/TAZ. When the Hippo pathway is ON, the MST1/2–SAV1 complex activates the LATS1/2–MOB1A/B complex through a kinase cascade, resulting in phosphorylation of YAP/TAZ. Phosphorylated YAP/TAZ (indicated by P in the figure) are retained in the cytoplasm and degraded, preventing their nuclear accumulation and downstream gene transcription. In contrast, when the Hippo pathway is OFF, YAP/TAZ remain unphosphorylated, accumulate in the nucleus, bind to TEAD transcription factors, and activate gene expression. Therefore, in non-cancerous cells, cell proliferation is controlled by turning the Hippo pathway ON and OFF. Bottom panel: Based on the findings of this study, endometrioid cancer cells exhibit reduced Hippo pathway activity (Hippo OFF), leading to the nuclear accumulation of YAP/TAZ and the enhanced transcription of target genes such as GLUT1. Upregulation of GLUT1 promotes glucose uptake and contributes to cancer cell proliferation, survival, and invasion.

Similar articles

References

    1. Sung H., Ferlay J., Siegel R.L., Laversanne M., Soerjomataram I., Jemal A., Bray F. Global Cancer Statistics 2020: GLOBOCAN Estimates of Incidence and Mortality Worldwide for 36 Cancers in 185 Countries. CA Cancer J. Clin. 2021;71:209–249. doi: 10.3322/caac.21660. - DOI - PubMed
    1. Makker V., MacKay H., Ray-Coquard I., Levine D.A., Westin S.N., Aoki D., Oaknin A. Endometrial Cancer. Nat. Rev. Dis. Primers. 2021;7:88. doi: 10.1038/s41572-021-00324-8. - DOI - PMC - PubMed
    1. Szablewski L. Expression of Glucose Transporters in Cancers. Biochim. Biophys. Acta. 2013;1835:164–169. doi: 10.1016/j.bbcan.2012.12.004. - DOI - PubMed
    1. Yu M., Yongzhi H., Chen S., Luo X., Lin Y., Zhou Y., Jin H., Hou B., Deng Y., Tu L., et al. The Prognostic Value of GLUT1 in Cancers: A Systematic Review and Meta-Analysis. Oncotarget. 2017;8:43356–43367. doi: 10.18632/oncotarget.17445. - DOI - PMC - PubMed
    1. Fu M., Hu Y., Lan T., Guan K.-L., Luo T., Luo M. The Hippo Signalling Pathway and Its Implications in Human Health and Diseases. Signal Transduct. Target. Ther. 2022;7:376. doi: 10.1038/s41392-022-01191-9. - DOI - PMC - PubMed

LinkOut - more resources