. 2025 Aug 5;17(15):2575.
doi: 10.3390/cancers17152575.

Efficacy of NAMPT Inhibitors in Pancreatic Cancer After Stratification by MAP17 (PDZK1IP1) Levels

Affiliations

Efficacy of NAMPT Inhibitors in Pancreatic Cancer After Stratification by MAP17 (PDZK1IP1) Levels

Eva M Verdugo-Sivianes et al. Cancers (Basel). .

Abstract

Background/Objectives: Pancreatic cancer (PC) is the seventh leading cause of cancer-related deaths worldwide, with its incidence rising each year. Despite its relatively low incidence, the aggressiveness of pancreatic cancer results in high mortality, with only 12% of patients surviving five years post-diagnosis. Surgical resection remains the only potentially curative treatment, but the tumor is often diagnosed at an advanced stage. The goal of this work is to identify vulnerabilities that can affect the efficacy of treatments and improve the efficacy of therapy. Methods: MAP17 overexpression in pancreatic cancer cell lines, RT-qPCR analysis, xenografts, in vitro and in vivo treatments, analysis of data from pancreatic tumors in transcriptomic patient databases. Results: We studied the prognostic and predictive value of MAP17 (PDZK1IP1) expression in pancreatic cancer, and we found that high MAP17 mRNA expression was associated with poor prognosis. In addition, single-cell analysis revealed that high MAP17 expression was present only in tumor cells. We investigated whether the response to various antitumor agents depended on MAP17 expression. In 2D culture, MAP17-expressing pancreatic cancer cells responded better to gemcitabine and 5-fluorouracil. However, in vivo xenograft tumors with MAP17 expression showed resistance to all treatments. Additionally, MAP17-expressing cells had a high NAD pool, which seems to be effectively depleted in vivo by NAMPT inhibitors, the primary enzyme for NAD biosynthesis. Conclusions: Our findings suggest that MAP17 expression could enhance the prognostic stratification of pancreatic cancer patients. Moreover, the coadministration of NAMPT inhibitors with current treatments may sensitize tumors with high MAP17 expression to chemotherapy and improve the efficacy of chemotherapy.

Keywords: MAP17; NAD; biomarkers; chemotherapy; pancreatic cancer; prognosis.


Conflict of interest statement

The authors declare that this research was conducted in the absence of any commercial or financial relationships that could be construed as potential conflicts of interest.

Figures

Figure 1
Figure 1
MAP17 is upregulated in pancreatic adenocarcinoma. (A) MAP17 expression in a TCGA pancreatic cancer dataset. (B) MAP17 expression in GSE62165, GSE62452 and GSE183795 public pancreatic cancer datasets. (C) MAP17 protein levels in LinkedOmics dataset. (D) MAP17 expression in a HUVR-IBIS cohort. Box plots showing the expression levels of MAP17 in pancreatic tumor tissue (red) or normal tissue (black). The data were analyzed by comparing the tumor versus the normal samples via Student’s t test. * p < 0.05, ** p < 0.01, *** p < 0.001. (E) Representative examples of MAP17 expression in tumors in a HUVR-IBIS cohort, as determined by immunohistochemistry. Tumor samples were classified in four categories according to the number of stained cells and the signal intensity: no MAP17 expression (0); mild MAP17 expression (1+); moderate MAP17 expression (2+); and intense MAP17 expression (3+). (F) Percentage of patients with low (blue) and high MAP17 (green) expression in our cohort of pancreatic tumor samples (n = 97). The score for high expression tumors was > 0.75. (G,H) MAP17 expression in PAAD_CRA001160 at single-cell resolution. Graphs showing the localization of MAP17 in the pancreatic tumor microenvironment. (I,J) Kaplan–Meier plots showing the overall survival of patients with high (red) or low (blue) MAP17 expression levels in the TCGA (I) and GSE62452 and GSE183795 (J) pancreatic cancer datasets. Dotted lines indicate the confidence interval. The data were analyzed via log-rank test, and the associated p values are shown in the graphs.
Figure 2
Figure 2
Overexpression of MAP17 increases the tumorigenicity and stemness of pancreatic cancer cell lines in vitro. (A,B) Validation of the overexpression of MAP17 in PANC-1 and HPAF-II pancreatic tumor cell lines by Western blotting (A) and RT–qPCR (B). Cells were transfected with an empty vector (EV) as a control or with MAP17 cDNA. (C) Clonogenic assay of PANC-1 and HPAF-II control and MAP17 cell lines. Cells were seeded at low density, and after 14 days, colonies were counted, and their sizes were measured. Representative images are shown. (D) Growth curves of the PANC-1 and HPAF-II control and MAP17-expressing cell lines. The values were represented referring to day 0. (E) Percentages of holoclones, meroclones and paraclones generated by PANC-1 and HPAF-II control and MAP17-expressing cell lines seeded at low density for 14 days. (F) Percentages of tumorspheres formed from PANC-1 and HPAF-II control and MAP17-expressing cell lines. (G) Quantification of the percentages of CD133+ cells among the PANC-1 and HPAF-II control and MAP17-expressing cells, as determined by FACS. (H,I) Growth of xenograft tumors formed from PANC-1 (H) and HPAF-II (I) control (the parental cell expressing only the EV) and MAP17-overexpressing cell lines (N = 6). (J) Representative image of a tumor with a scale ruler to visualize the sizes of the tumors. Cells were injected into nude mice, and tumor size was measured weekly. The mean ± standard deviation for a minimum of 3 independent experiments performed in triplicate is presented. Statistical analysis was performed with Student’s t test, * p < 0.05, ** p < 0.01, *** p < 0.001.
Figure 3
Figure 3
Tumors with high levels of MAP17 do not respond to conventional therapy in vivo. Determination of the tumor volume in xenograft tumors derived from PANC-1 control and MAP17-overexpressing cells (N = 6) after treatment with cisplatin (A), 5FU (B), gemcitabine (GMZ) (C). Cells were injected into nude mice, and tumor size was measured weekly. The mice received the treatment for 3 weeks. On the left we show the tumor growth and on the right the statistical comparisons between groups at the end point (final tumor volume). In the tumor growth curves, the gray bar indicates the period of treatment. Images show the sizes of the tumors at the end of the experiment. To facilitate the interpretation of the data, we showed each treatment individually, but controls are the same in each case. The mean ± standard deviation is presented for a single experiment with six independent samples (n = 6). Statistical analysis was performed with Student’s t test, * p < 0.05, ** p < 0.01, *** p < 0.001.
Figure 4
Figure 4
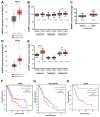
NAMPT and NAPRT are upregulated in pancreatic adenocarcinoma. (A) NAMPT expression in a TCGA pancreatic cancer dataset. (B) NAMPT expression in GSE62165, GSE62452 and GSE183795 public pancreatic cancer datasets. (C) NAMPT protein levels in LinkedOmics dataset. (D) NAPRT expression in a TCGA pancreatic cancer dataset. (E) NAPRT expression in GSE62165, GSE62452 and GSE183795 public pancreatic cancer datasets. (F,G) Kaplan–Meier plots showing the overall survival of patients with high (red) or low (blue) NAMPT expression levels in the TCGA (F) and GSE183795 (G) pancreatic cancer datasets. (H) Kaplan–Meier plots showing the overall survival of patients with high (red) or low (blue) NAPRT expression levels in the TCGA pancreatic cancer datasets. Dotted lines indicate the confidence interval. The data of survival were analyzed via log-rank test, and the associated p values are shown in the graphs. Statistical analysis was performed with Student’s t test, * p < 0.05, ** p < 0.01, *** p < 0.001.
Figure 5
Figure 5
MAP17 expression correlates with NAMPT and NAPRT expressions, two enzymes involved in the NAD biosynthesis. (A) Total NAD levels in PANC-1 and HPAF-II control and MAP17-overexpressing cell lines as determined by cyclization assay. (B) Correlation of MAP17 and different enzymes involved in NAD biosynthesis in 12 different pancreatic cancer databases. Green boxes indicate a positive correlation, whereas red boxes indicate a negative correlation. White boxes show no correlation. (C) Correlation of NAMPT and MAP17 in TCGA, GSE93326 and GSE208732 datasets. (D) Correlation of NAPRT and MAP17 in TCGA, GSE93326 and GSE21501 datasets. (E) Correlation of PARP1 and MAP17 in the LinkedOmics and GSE253260 datasets. (F) Correlation of PARP2 and MAP17 in the TCGA and GSE21501 datasets. (G) Correlation of SIRT1 and MAP17 in GSE62452 and GSE183795 datasets. (H) Correlation of SIRT3 and MAP17 in the TCGA dataset. (I) Correlation of SIRT2 and MAP17 in the TCGA and LinkedOmics datasets. (J) Correlation of SIRT4 and MAP17 in the TCGA dataset. Statistical analysis was performed with Student’s t test, * p < 0.05, ** p < 0.01.
Figure 6
Figure 6
The inhibition of NAMPT sensitizes MAP17 tumors to conventional therapy in vivo. (A,B) Determination of the tumor volume in xenografts derived from PANC-1 cells that overexpressed MAP17 (N = 4) after treatment with GNE617 (A) or GMX1778 (B) alone and in combination with gemcitabine (GMZ) or cisplatin (Cis). Cells were injected into nude mice, and tumor size was measured weekly. Mice received the treatment for 3 weeks. Figures show the average of two different experiments performed independently. On the left we show the tumor growth and on the right the statistical comparisons between groups at the end point (final tumor volume). In the tumor growth curves, the gray bar indicates the period of treatment. Images show the sizes of the tumors at the end of the experiment. To facilitate the interpretation of the data, we showed each NAMPT treatment individually, but controls are the same in each case. The mean ± standard deviation is presented for a single or two independent experiments with four independent samples (n = 4) Statistical analysis was performed with Student’s t test, * p < 0.05, ** p < 0.01, *** p < 0.001.

References

    1. Partyka O., Pajewska M., Kwaśniewska D., Czerw A., Deptała A., Budzik M., Cipora E., Gąska I., Gazdowicz L., Mielnik A., et al. Overview of Pancreatic Cancer Epidemiology in Europe and Recommendations for Screening in High-Risk Populations. Cancers. 2023;15:3634. doi: 10.3390/cancers15143634. - DOI - PMC - PubMed
    1. Siegel R.L., Giaquinto A.N., Jemal A. Cancer statistics, 2024. CA A Cancer J. Clin. 2024;74:12–49. doi: 10.3322/caac.21820. - DOI - PubMed
    1. Conroy T., Pfeiffer P., Vilgrain V., Lamarca A., Seufferlein T., O’rEilly E., Hackert T., Golan T., Prager G., Haustermans K., et al. Pancreatic cancer: ESMO Clinical Practice Guideline for diagnosis, treatment and follow-up. Ann. Oncol. 2023;34:987–1002. doi: 10.1016/j.annonc.2023.08.009. - DOI - PubMed
    1. Yurgelun M.B. Building on More Than 20 Years of Progress in Pancreatic Cancer Surveillance for High-Risk Individuals. J. Clin. Oncol. 2022;40:3230–3234. doi: 10.1200/JCO.22.01287. - DOI - PubMed
    1. Latenstein A.E., van der Geest L.G., Bonsing B.A., Koerkamp B.G., Mohammad N.H., de Hingh I.H., de Meijer V.E., Molenaar I.Q., van Santvoort H.C., van Tienhoven G., et al. Nationwide trends in incidence, treatment and survival of pancreatic ductal adenocarcinoma. Eur. J. Cancer. 2020;125:83–93. doi: 10.1016/j.ejca.2019.11.002. - DOI - PubMed

LinkOut - more resources