. 2025 Jul 25;14(15):2303.
doi: 10.3390/plants14152303.

Integrated Transcriptomic and Metabolomic Analyses Reveal Key Antioxidant Mechanisms in Dendrobium huoshanense Under Combined Salt and Heat Stress

Affiliations

Integrated Transcriptomic and Metabolomic Analyses Reveal Key Antioxidant Mechanisms in Dendrobium huoshanense Under Combined Salt and Heat Stress

Xingen Zhang et al. Plants (Basel). .

Abstract

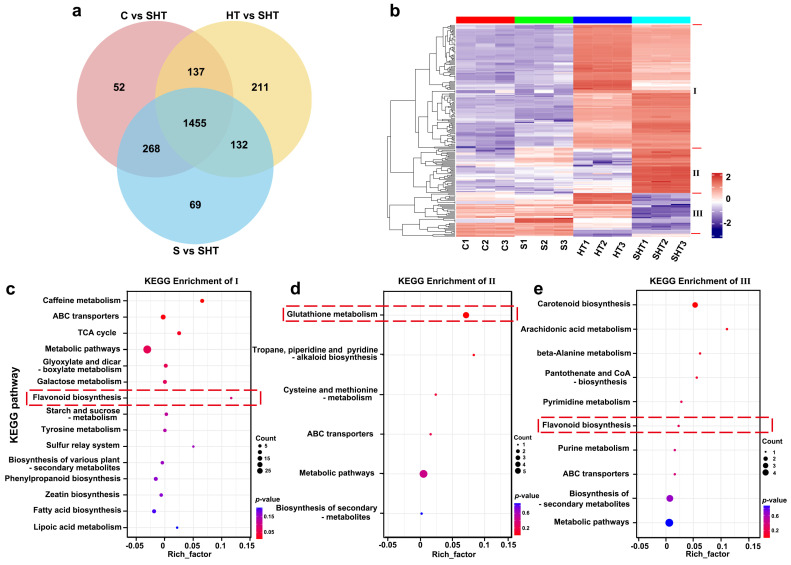
Combined abiotic stresses often impose greater challenges to plant survival than individual stresses. In this study, we focused on elucidating the physiological and molecular mechanisms underlying the response of Dendrobium huoshanense to combined salt and heat stress by integrating physiological, transcriptomic, and metabolomic analyses. Our results demonstrated that high temperature plays a dominant role in the combined stress response. Physiological assays showed increased oxidative damage under combined stress, accompanied by significant activation of antioxidant enzyme systems (SOD, POD, CAT). Metabolomic analysis revealed significant enrichment of glutathione metabolism and flavonoid biosynthesis pathways, with key antioxidants such as glutathione and naringenin chalcone accumulating under combined stress. Transcriptomic data supported these findings, showing differential regulation of stress-related genes, including those involved in reactive oxygen species scavenging and secondary metabolism. These results highlight a coordinated defense strategy in D. huoshanense, involving both enzymatic and non-enzymatic antioxidant systems to maintain redox homeostasis under combined stress. This study provides novel insights into the molecular mechanisms underlying combined stress tolerance and lays the foundation for improving stress resilience in medicinal orchids.

Keywords: Dendrobium huoshanense; antioxidant systems; combined salt and high-temperature stress; metabolome; transcriptome.


Conflict of interest statement

The authors declare no conflicts of interest.

Figures

Figure 1
Figure 1
Physiological and biochemical responses of Dendrobium huoshanense under salt (S) stress, high-temperature (HT) stress, and combined (SHT) stress. (a) Phenotypic appearance of D. huoshanense plants after 72 h of exposure to S, HT, or SHT. Scale bar = 2 cm. (b) DAB (3,3′-diaminobenzidine) staining of leaves after 48 h of treatment, showing hydrogen peroxide (H2O2) accumulation as a brown precipitate. Scale bar = 0.5 cm. (c) NBT (nitroblue tetrazolium) staining of leaves after 48 h, showing superoxide anion (O2) accumulation as a blue precipitate. Red dashed lines indicate separation between different treatment groups for clarity. Scale bar = 0.5 cm. (d) Total malondialdehyde (MDA) content in plants under each stress condition. (eg) Activities of antioxidant enzymes under each stress: (e) superoxide dismutase (SOD), (f) catalase (CAT), and (g) peroxidase (POD). (h,i) ROSlevels in leaves after 48 h of treatment: (h) superoxide anion content and (i) hydrogen peroxide content. Data are presented as mean ± SE (n = 3). Different lowercase letters (a, b, c, d) indicate significant differences among treatments based on one-way ANOVA followed by Duncan’s multiple range test (p < 0.05).
Figure 2
Figure 2
Overview of differentially expressed genes in D. huoshanense under different stress conditions. (a) Principal component analysis of the transcriptome under control and stress treatments. (b) Numbers of genes that are upregulated (left) or downregulated (right) under each stress condition. (c) Venn diagram showing the overlap of DEGs among the stress conditions. (df) Volcano plots of gene expression changes for comparisons of control vs. combined stress, salt vs. combined stress, and high-temperature vs. combined stress, respectively. Colors: in volcano plots, red dots indicate significantly upregulated genes, green dots indicate significantly downregulated genes, and gray dots indicate non-significant genes.
Figure 3
Figure 3
qRT-PCR validation of selected DEGs under the stress treatments. For representative genes, bar charts show the relative expression levels under control, salt, high-temperature, and combined stress conditions. Actin is an internal reference gene. The close agreement between the qRT-PCR results and RNA-seq data confirms the reliability of the transcriptomic analysis. The red solid line represents the regression fit between qRT-PCR and RNA-seq data, indicating the close agreement between the two datasets. Different letters (a, b, c, d) indicate statistically significant differences among treatments as determined by one-way ANOVA followed by Duncan’s multiple range test (p < 0.05).
Figure 4
Figure 4
Identification of WGCNA gene co-expression modules and their correlation with stress treatments. (a) Clustering dendrogram of DEGs based on topological overlap, with modules labeled in different colors. (b) Heatmap showing correlations between module eigengenes and the stress conditions (green and red denote positive and negative correlations, respectively). (c) Gene Ontology (GO) enrichment analysis for genes in the red module. (d) KEGG pathway enrichment analysis for genes in the red module. Identification and correlation analysis of WGCNA modules. Red dashed lines in (bd) highlight key modules or enriched pathways related to glutathione and flavonoid metabolism under stress conditions.
Figure 5
Figure 5
Distribution of differentially accumulated metabolites (DAMs) in D. huoshanense under salt, high-temperature, and combined stress. (a) Principal component analysis (PCA) of the metabolome under control and stress conditions. (b) Numbers of metabolites that show increased accumulation (upregulated, left) or decreased accumulation (downregulated, right) under each stress condition. Red represents control vs. combined stress, blue represents salt vs. combined stress and yellow represents high temperature vs. combined stress (c) Classification and proportional representation of DAMs by metabolic category. (df) KEGG pathway enrichment analyses for metabolites in the comparisons of control vs. combined stress, salt vs. combined stress, and high-temperature vs. combined stress, respectively.
Figure 6
Figure 6
Analysis of DAMs that are common to all three stress comparisons (C vs. SHT, S vs. SHT, and HT vs. SHT). (a) Venn diagram showing the overlap of DAMs among the three comparisons (the center subset represents metabolites shared by all three). (b) Cluster analysis of the metabolites shared among all three comparisons, revealing three distinct clusters (Class I, II, and III) with different accumulation patterns. (ce) KEGG enrichment analyses for the metabolites in Class I, Class II, and Class III, respectively. Red dashed lines in (ce) highlight key modules or enriched pathways related to glutathione and flavonoid metabolism under stress conditions.
Figure 7
Figure 7
Differential changes in genes and metabolites involved in the glutathione (GSH) metabolism pathway under stress. Enzymes in the pathway are labeled by their gene symbols: GGCT (gamma-glutamylcyclotransferase), GST (glutathione S-transferase), PGD (6-phosphogluconate dehydrogenase), IDH1 (isocitrate dehydrogenase), and GGT (gamma-glutamyltranspeptidase). Changes in gene expression (DEGs) and metabolite levels (DAMs) are indicated as log2 fold changes relative to the control.
Figure 8
Figure 8
Differential changes in genes and metabolites involved in the flavonoid biosynthesis pathway under stress. Enzymes are labeled by their gene symbols: CHS (chalcone synthase), HCT (shikimate O-hydroxycinnamoyl transferase), C3′H (flavonoid 3′-hydroxylase), CHI (chalcone isomerase), F3′5′H (flavonoid 3′,5′-hydroxylase), and F3′H (flavonoid 3′-hydroxylase). The changes in gene expression and in flavonoid metabolite accumulation are shown as log2 fold changes compared to the control.
Figure 9
Figure 9
Proposed regulatory mechanism of D. huoshanense in response to combined salt and high-temperature stress. Key stress-response pathways are highlighted in different colors in the schematic diagram. Combined stress leads to excessive accumulation of reactive oxygen species such as singlet oxygen (1O2), superoxide (O2), and hydroxyl radicals (OH). The elevated ROS levels activate antioxidant defense systems, in which enzymes such as SOD, CAT, and POD play a key role in ROS detoxification, accompanied by metabolic adaptations including enhanced glutathione metabolism and flavonoid biosynthesis.

Similar articles

References

    1. Torres M.A., Dangl J.L. Functions of the respiratory burst oxidase in biotic interactions, abiotic stress and development. Curr. Opin. Plant Biol. 2005;8:397–403. doi: 10.1016/j.pbi.2005.05.014. - DOI - PubMed
    1. Urano K., Kurihara Y., Seki M., Shinozaki K. ‘Omics’ analyses of regulatory networks in plant abiotic stress responses. Curr. Opin. Plant Biol. 2010;13:132–138. doi: 10.1016/j.pbi.2009.12.006. - DOI - PubMed
    1. Zhu J.K. Abiotic Stress Signaling and Responses in Plants. Cell. 2016;167:313–324. doi: 10.1016/j.cell.2016.08.029. - DOI - PMC - PubMed
    1. DeLoose M., Clua J., Cho H., Zheng L., Masmoudi K., Desnos T., Krouk G., Nussaume L., Poirier Y., Rouached H. Recent advances in unraveling the mystery of combined nutrient stress in plants. Plant J. 2024;117:1764–1780. doi: 10.1111/tpj.16511. - DOI - PubMed
    1. Lawas L.M.F., Zuther E., Jagadish S.K., Hincha D.K. Molecular mechanisms of combined heat and drought stress resilience in cereals. Curr. Opin. Plant Biol. 2018;45:212–217. doi: 10.1016/j.pbi.2018.04.002. - DOI - PubMed

LinkOut - more resources