. 2025 Aug 2;14(15):2383.
doi: 10.3390/plants14152383.

Unveiling Stage-Specific Flavonoid Dynamics Underlying Drought Tolerance in Sweet Potato (Ipomoea batatas L.) via Integrative Transcriptomic and Metabolomic Analyses

Affiliations

Unveiling Stage-Specific Flavonoid Dynamics Underlying Drought Tolerance in Sweet Potato (Ipomoea batatas L.) via Integrative Transcriptomic and Metabolomic Analyses

Tao Yin et al. Plants (Basel). .

Abstract

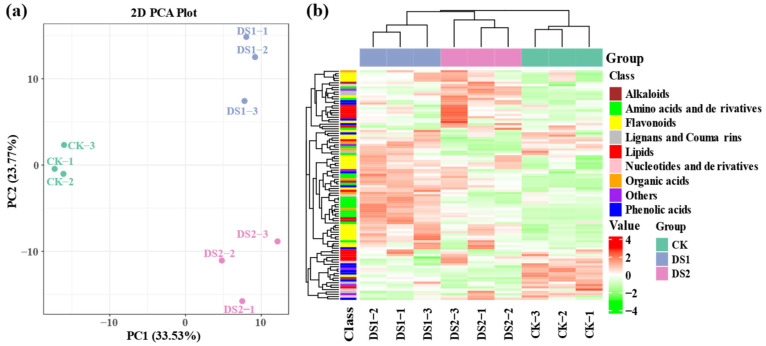
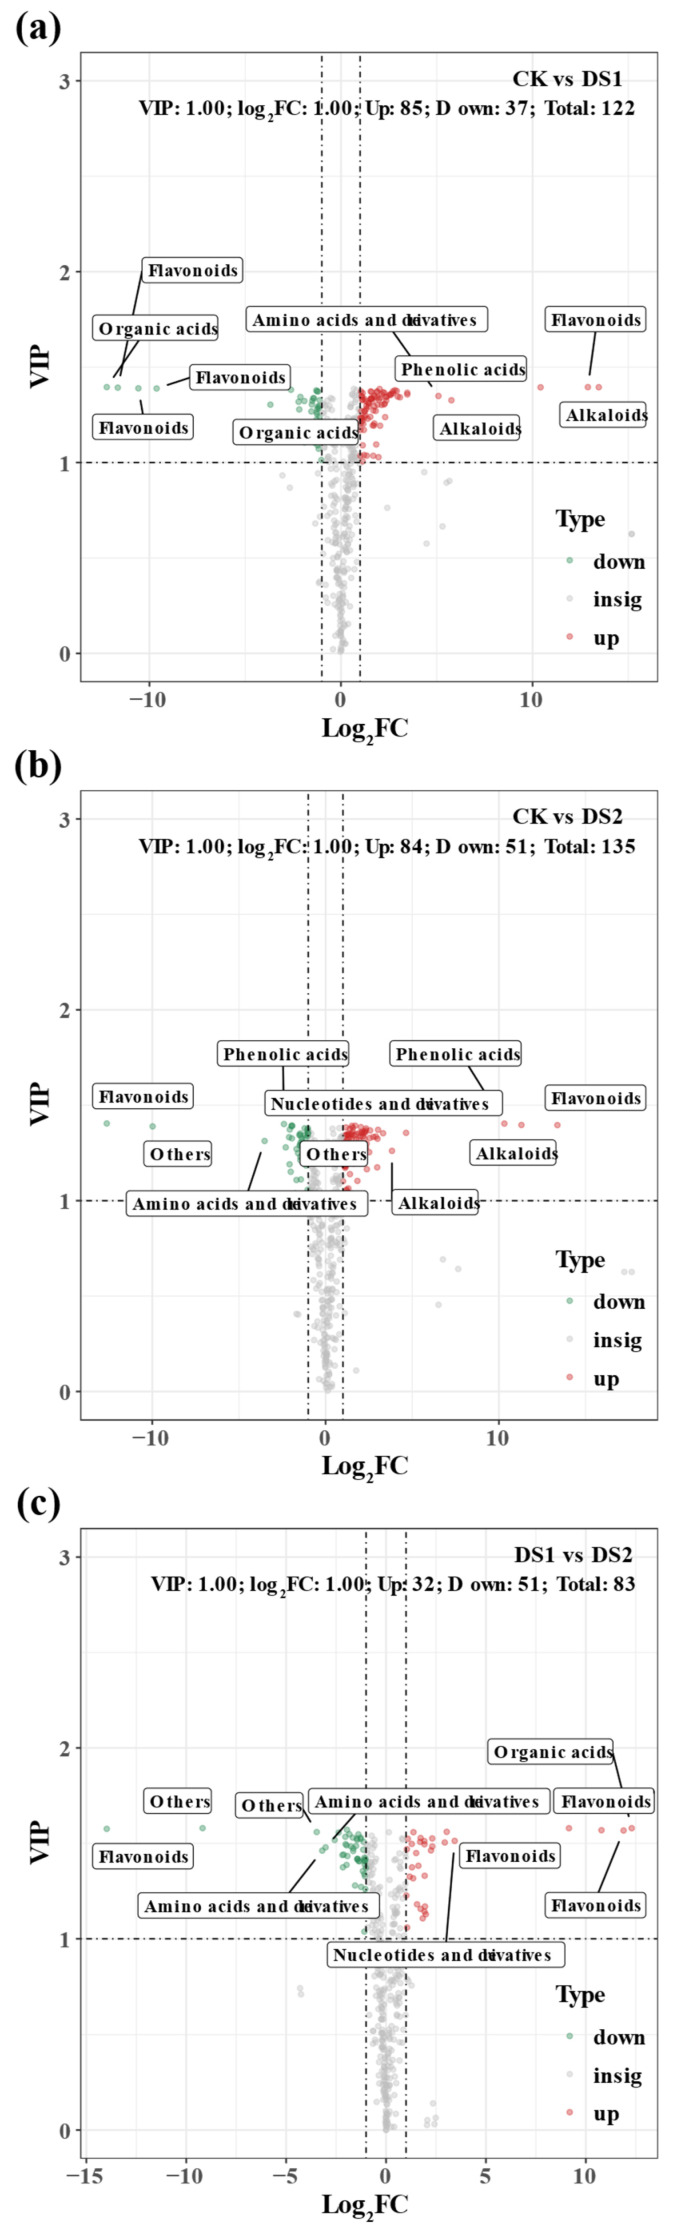
Drought stress severely limits the productivity of sweet potato (Ipomoea batatas L.), yet the stage-specific molecular mechanisms of its adaptation remain poorly understood. Therefore, we integrated transcriptomics and extensive targeted metabolomics analysis to investigate the drought responses of the sweet potato cultivar 'Luoyu 11' during the branching and tuber formation stage (DS1) and the storage root expansion stage (DS2) under controlled drought conditions (45 ± 5% field capacity). Transcriptome analysis identified 8292 and 13,509 differentially expressed genes in DS1 and DS2, respectively, compared with the well-watered control (75 ± 5% field capacity). KEGG enrichment analysis revealed the activation of plant hormone signaling, carbon metabolism, and flavonoid biosynthesis pathways, and more pronounced transcriptional changes were observed during the DS2 stage. Metabolomic analysis identified 415 differentially accumulated metabolites across the two growth periods, with flavonoids being the most abundant (accounting for 30.3% in DS1 and 23.7% in DS2), followed by amino acids and organic acids, which highlighted their roles in osmotic regulation and oxidative stress alleviation. Integrated omics analysis revealed stage-specific regulation of flavonoid biosynthesis under drought stress. Genes such as CYP75B1 and IF7MAT were consistently downregulated, whereas flavonol synthase and glycosyltransferases exhibited differential expression patterns, which correlated with the selective accumulation of trifolin and luteoloside. Our findings provide novel insights into the molecular basis of drought tolerance in sweet potato and offer actionable targets for breeding and precision water management in drought-prone regions.

Keywords: drought stress; flavonoid biosynthesis; metabolomics; stage-specific adaptation; transcriptomics.


Conflict of interest statement

The authors declare no conflicts of interest.

Figures

Figure 1
Figure 1
Transcriptomic analysis of sweet potato (Ipomoea batatas L.) leaves under drought stress at different growth stages. (a) Principal component analysis (PCA) showing the overall differences in gene expression profiles among treatment groups. (b) Hierarchical clustering heatmap displaying significantly differentially expressed genes (DEGs). Rows represent individual DEGs, columns represent individual samples. The color gradient from red (upregulated) to green (downregulated) indicates normalized gene expression levels (Z-score) relative to the mean expression across all samples. Gene clusters (1–9), identified via K-means clustering, are indicated on the left side of the heatmap. CK, with soil moisture maintained at 75 ± 5% field capacity (FC) throughout the growth period; DS1, drought stress with soil moisture maintained at 45 ± 5% FC for 15 days during the branching and tuber formation stage (55–70 days post-planting); DS2, drought stress with soil moisture maintained at 45 ± 5% FC for 15 days during the storage root expansion stage (90–105 days post-planting).
Figure 2
Figure 2
Volcano plots showing significantly differentially expressed genes (DEGs) in sweet potato (Ipomoea batatas L.) leaves under drought stress at different growth stages. Pairwise comparisons include: (a) CK (control; soil moisture maintained at 75 ± 5% field capacity (FC) throughout the growth period) vs. DS1 (drought stress; soil moisture maintained at 45 ± 5% FC for 15 days during the branching and tuber formation stage, 55–70 days after planting); (b) CK vs. DS2 (drought stress; soil moisture maintained at 45 ± 5% FC for 15 days during the storage root expansion stage, 90–105 days after planting); and (c) DS1 vs. DS2. The x–axis represents the log2 fold change (log2FC) of gene expression, and the y–axis represents statistical significance (−log10 p-value). Each dot represents a gene: red and green dots indicate significantly upregulated and downregulated genes, respectively (|log2FC| ≥ 1 and p < 0.05). Vertical dashed lines indicate the fold change threshold (log2FC = ±1).
Figure 3
Figure 3
Kyoto Encyclopedia of Genes and Genomes (KEGG) pathway enrichment analysis of significantly differentially expressed genes (DEGs) in sweet potato (Ipomoea batatas L.) leaves under drought stress at different developmental stages. Shown are the top 30 enriched KEGG pathways identified from the following pairwise comparisons: (a) CK (control; soil moisture maintained at 75 ± 5% field capacity (FC) throughout the growth period) vs. DS1 (drought stress; soil moisture maintained at 45 ± 5% FC for 15 days during the branching and tuber formation stage, 55–70 days after planting); (b) CK vs. DS2 (drought stress; soil moisture maintained at 45 ± 5% FC for 15 days during the storage root expansion stage, 90–105 days after planting); and (c) DS1 vs. DS2. The y–axis indicates the KEGG pathways, and the x–axis represents the Rich factor (the ratio of DEGs to the total number of annotated genes in each pathway). Dot size reflects the number of DEGs involved in each pathway, while dot color indicates the significance level of pathway enrichment (the darker the color, the smaller the p-value).
Figure 4
Figure 4
Metabolomic analysis of sweet potato (Ipomoea batatas L.) leaves under drought stress at different growth stages. (a) Principal component analysis (PCA) plot illustrating the separation of metabolic profiles among treatment groups. (b) Hierarchical clustering heatmap of significantly differentially accumulated metabolites (DAMs). Each row represents a metabolite, categorized by chemical class as indicated by the color bars on the left, and each column represents an individual sample grouped by treatment. The color gradient from green (low abundance) to red (high abundance) indicates the normalized abundance (Z-score) of metabolites. CK, soil moisture maintained at 75 ± 5% field capacity (FC) throughout the growth period; DS1, drought stress with soil moisture maintained at 45 ± 5% FC for 15 days during the branching and tuber formation stage (55–70 days after planting); DS2, drought stress with soil moisture maintained at 45 ± 5% FC for 15 days during the storage root expansion stage (90–105 days after planting).
Figure 5
Figure 5
Classification and distribution of significantly differentially accumulated metabolites (DAMs) identified in sweet potato (Ipomoea batatas L.) leaves under drought stress at different growth stages. The composition of DAMs is shown for pairwise comparisons among treatments: (a) CK (control; soil moisture maintained at 75 ± 5% field capacity (FC) throughout the growth period) vs. DS1 (drought stress; soil moisture maintained at 45 ± 5% FC for 15 days during the branching and tuber formation stage, 55–70 days after planting); (b) CK vs. DS2 (drought stress; soil moisture maintained at 45 ± 5% FC for 15 days during the storage root expansion stage, 90–105 days after planting); and (c) DS1 vs. DS2.
Figure 6
Figure 6
Volcano plots showing differentially accumulated metabolites (DAMs) in sweet potato (Ipomoea batatas L.) leaves under drought stress at different growth stages. Pairwise comparisons of metabolite profiles among treatments: (a) CK (control; soil moisture maintained at 75 ± 5% field capacity (FC) throughout the growth period) vs. DS1 (drought stress; soil moisture maintained at 45 ± 5% FC for 15 days during the branching and tuber formation stage, 55–70 days after planting); (b) CK vs. DS2 (drought stress; soil moisture maintained at 45 ± 5% FC for 15 days during the storage root expansion stage, 90–105 days after planting); and (c) DS1 vs. DS2. Horizontal and vertical dashed lines indicate significance thresholds (|log2 fold change| ≥ 1 and VIP ≥ 1). Red and green dots represent significantly upregulated and downregulated metabolites, respectively, while gray dots denote non-significant metabolites. The top five metabolite classes with the highest numbers of up- and down-regulated metabolites are annotated.
Figure 7
Figure 7
KEGG pathway enrichment analysis of differentially accumulated metabolites (DAMs) in sweet potato (Ipomoea batatas L.) leaves under drought stress at different growth stages. The top 30 enriched KEGG metabolic pathways identified from pairwise comparisons are shown: (a) CK (control; soil moisture maintained at 75 ± 5% field capacity (FC) throughout the growth period) vs. DS1 (drought stress; soil moisture maintained at 45 ± 5% FC for 15 days during the branching and tuber formation stage, 55–70 days after planting); (b) CK vs. DS2 (drought stress; soil moisture maintained at 45 ± 5% FC for 15 days during the storage root expansion stage, 90–105 days after planting); and (c) DS1 vs. DS2. The x–axis represents the Rich factor (the proportion of DAMs in each pathway relative to the total annotated metabolites). Dot size reflects the number of significantly enriched DAMs, while dot color indicates statistical significance, with red representing higher significance (smaller p-values).
Figure 8
Figure 8
Integrated transcriptomic and metabolomic analysis of flavone and flavonol biosynthesis pathways in sweet potato (Ipomoea batatas L.) leaves under drought stress at different growth stages. Heatmaps show the log2 fold changes of gene expression (squares) and metabolite abundance (ovals) derived from transcriptomic and metabolomic data in the following pairwise comparisons: CK (control; soil moisture maintained at 75 ± 5% field capacity (FC) throughout the growth period); DS1 (drought stress; soil moisture maintained at 45 ± 5% FC for 15 days during the branching and tuber formation stage, 55–70 days after planting); and DS2 (drought stress; soil moisture maintained at 45 ± 5% FC for 15 days during the storage root expansion stage, 90–105 days after planting).

Similar articles

References

    1. Low J.W., Thiele G. Understanding innovation: The development and scaling of orange-fleshed sweetpotato in major African food systems. Agric. Syst. 2020;179:102770. doi: 10.1016/j.agsy.2019.102770. - DOI - PMC - PubMed
    1. Motsa M.M., Modi A.T., Mabhaudhi T. Sweet potato (Ipomoea batatas L.) as a drought tolerant and food security crop. S. Afr. J. Sci. 2015;111:1–8. doi: 10.17159/sajs.2015/20140252. - DOI
    1. Neela S., Fanta S.W. Review on nutritional composition of orange-fleshed sweet potato and its role in management of vitamin A deficiency. Food Sci. Nutr. 2019;7:1920–1945. doi: 10.1002/fsn3.1063. - DOI - PMC - PubMed
    1. Zhou M., Hu S., Wang S., Yin T., Liu Q., Li H. Sweet potato yield and quality characteristics affected by different late-season irrigation levels. J. Sci. Food Agric. 2024;104:5207–5218. doi: 10.1002/jsfa.13350. - DOI - PubMed
    1. Gajanayake B., Reddy K.R., Shankle M.W., Arancibia R.A. Early-season soil moisture deficit reduces sweetpotato storage root initiation and development. HortScience. 2013;48:1457–1462. doi: 10.21273/HORTSCI.48.12.1457. - DOI

LinkOut - more resources