. 2025 Aug 2;14(15):2388.
doi: 10.3390/plants14152388.

Integrated Transcriptomic and Metabolomic Analysis Reveals Nitrogen-Mediated Delay of Premature Leaf Senescence in Red Raspberry Leaves

Affiliations

Integrated Transcriptomic and Metabolomic Analysis Reveals Nitrogen-Mediated Delay of Premature Leaf Senescence in Red Raspberry Leaves

Qiang Huo et al. Plants (Basel). .

Abstract

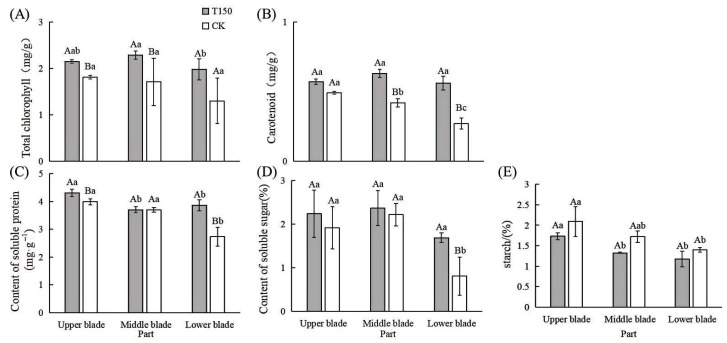
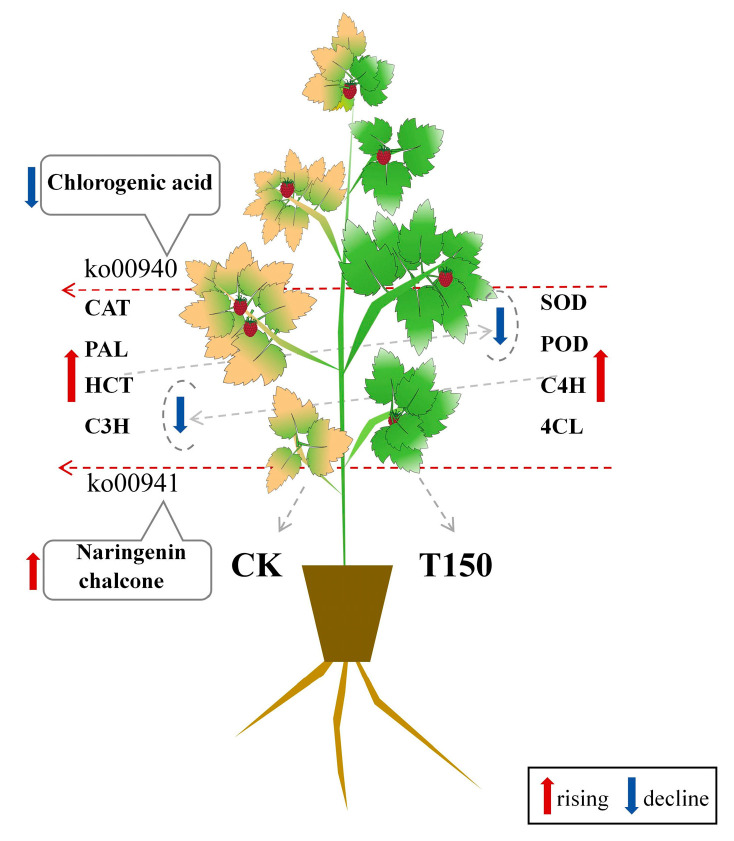
The premature senescence of red raspberry leaves severely affects plant growth. In this study, the double-season red raspberry cultivar 'Polka' was used, with N150 (0.10 g N·kg-1) selected as the treatment group (T150) and N0 (0 g N·kg-1) set as the control (CK). This study systematically investigated the mechanism of premature senescence in red raspberry leaves under different nitrogen application levels by measuring physiological parameters and conducting a combined multi-omics analysis of transcriptomics and metabolomics. Results showed that T150 plants had 8.34 cm greater height and 1.45 cm greater ground diameter than CK. The chlorophyll, carotenoid, soluble protein, and sugar contents in all leaf parts of T150 were significantly higher than those in CK, whereas soluble starch contents were lower. Malondialdehyde (MDA) content and superoxide anion (O2-) generation rate in the lower leaves of T150 were significantly lower than those in CK. Superoxide sismutase (SOD) and peroxidase (POD) activities in the middle and lower functional leaves of T150 were higher than in CK, while catalase (CAT) activity was lower. Transcriptomic analysis identified 4350 significantly differentially expressed genes, including 2062 upregulated and 2288 downregulated genes. Metabolomic analysis identified 135 differential metabolites, out of which 60 were upregulated and 75 were downregulated. Integrated transcriptomic and metabolomic analysis showed enrichment in the phenylpropanoid biosynthesis (ko00940) and flavonoid biosynthesis (ko00941) pathways, with the former acting as an upstream pathway of the latter. A premature senescence pathway was established, and two key metabolites were identified: chlorogenic acid content decreased, and naringenin chalcone content increased in early senescent leaves, suggesting their pivotal roles in the early senescence of red raspberry leaves. Modulating chlorogenic acid and naringenin chalcone levels could delay premature senescence. Optimizing fertilization strategies may thus reduce senescence risk and enhance the productivity, profitability, and sustainability of the red raspberry industry.

Keywords: leaf senescence; metabolome; red raspberry; transcriptome.


Conflict of interest statement

The authors declare that they have no known competing financial interests or personal relationships that could have appeared to influence the work reported in this paper.

Figures

Figure 1
Figure 1
Experimental design process.
Figure 2
Figure 2
Relevant measurement indicators.
Figure 3
Figure 3
Phenotypic differences between premature senescent and normal red raspberry seedlings. (A) Plant height; (B) ground diameter; (C) crown width; (D) root length; (E) leaf thickness; (F) SPAD; (G) the lower leaves and branches of N0 and N150; (H) premature senescence red raspberry (left) and normal red raspberry (right). Note: (G) scale bar = 50 mm; (H) scale bar = 100 mm. Note: Different lowercase letters (a, b, c) indicate significant differences at p < 0.05 as determined by one-way ANOVA.
Figure 4
Figure 4
Growth traits and root morphology of red raspberry seedlings with normal and premature senescent leaves. (A) Plant height; (B) ground diameter; (C) pitch distance; (D) root length; (E) fresh weight of root; (F) root/shoot; (G) root activity; (H) root system differences between red raspberries with normal leaves and those with premature senescent leaves; (I) root buds of red raspberries with premature senescent leaves and those with normal leaves. Note: (H) scale bar = 3 cm; (I) scale bar = 1 cm. Note: Different lowercase letters (a, b) indicate significant differences at p < 0.05 as determined by one-way ANOVA.
Figure 5
Figure 5
Contents of photosynthetic pigments and osmoregulatory substances in different parts of leaves of normal and premature senile raspberry. (A) Total chlorophyll; (B) carotenoid; (C) soluble protein content; (D) soluble sugar content; (E) starch content. Note: Capital letters represent the difference between normal type and premature senescence type, and lowercase letters represent the difference of all parts, which is significant at the level of p < 0.05. The same as below.
Figure 6
Figure 6
Changes in membrane lipid peroxidation and antioxidant enzyme activities in two phenotypes of red raspberry. (A) MDA content; (B) O2− generation rate; (C) SOD activity; (D) POD activity; (E) CAT activity. Note: Capital letters represent the difference between normal type and premature senescence type, and lowercase letters represent the difference of all parts, which is significant at the level of p < 0.05.
Figure 7
Figure 7
Anatomical structure of normal and premature senescence raspberry leaves. Note: (a): normal upper part; (b): normal middle part; (c): normal lower part; (d): premature senescence upper part; (e): premature senescence middle part; (f): premature senescence lower part; scale bar = 20 µm.
Figure 8
Figure 8
Correlation analysis and characterization of DEGs. (A) Sample correlation test; (B) PCA principal components; (C) differentially expressed gene clustering; (D) volcano plot of differentially expressed genes. Note: T = T150. (C) Red indicates high-expression genes and green indicates low-expression genes; (D) red dots indicate upregulated genes in this group, blue dots indicate downregulated genes in this group, and grey dots indicate non-significant differentially expressed genes.
Figure 9
Figure 9
KEGG and GO enrichment analysis of DEGs between two red raspberry phenotypes. (A) KEGG pathway enrichment histogram; (B) KEGG pathway enrichment bubble plot of DEGs between the two phenotypes; (C) GO term enrichment histogram; (D) GO term enrichment scatter plot of DEGs between the two phenotypes. Note: T = T150.
Figure 10
Figure 10
Heatmap of physiological- and hormone-related DEGs between two red raspberry phenotypes. (A) Differential expression genes related to physiological indicators of two phenotypes of red raspberries. a: senescence-related. b: POD-related. c: CAT-related. d: starch-related. e: chlorophyll-related; (B) hormone related differentially expressed genes in two phenotypes of red raspberries. a: auxin-related. b: cytokinins-related. c: gibberellin-related. d: ABA-related. e: ethylene-related. f: brassinolide-related; Note: Red indicates upregulated genes, and blue indicates downregulated genes.
Figure 11
Figure 11
Hierarchical clustering heatmap of significantly different metabolites between two red raspberry phenotypes. (A) Positive ion mode; (B) negative ion mode. Note: red indicates upregulated metabolites, blue indicates downregulated metabolites; T = T150.
Figure 12
Figure 12
KEGG enrichment pathway diagram and differential metabolite cluster heat map. (A) KEGG enrichment pathway diagram of differential metabolites of two phenotypic red raspberries; (B) biosynthesis of secondary metabolites; (C) metabolic pathways. Note: T = T150.
Figure 13
Figure 13
Key pathway of red raspberry premature senescence.
Figure 14
Figure 14
Joint transcriptome and metabolome results.

References

    1. Kirakosyan A., Seymour E.M., Kondoleon N., Gutierrez E., Wolforth J., Bolling S. The Intake of Red Raspberry Fruit is Inversely Related to Cardiac Risk Factors Associated with Metabolic Syndrome. J. Funct. Foods. 2018;41:83–89. doi: 10.1016/j.jff.2017.12.033. - DOI
    1. Rao A.V., Snyder D.M. Raspberries and Human Health: A Review. J. Agric. Food Chem. 2010;58:3871–3883. doi: 10.1021/jf903484g. - DOI - PubMed
    1. Galli R.L., Carey A.N., Luskin K.A., Bielinski D.F., Shukitt-Hale B. Red Raspberries Can Improve Motor Function in Aged Rats. J. Berry Res. 2016;6:97–103. doi: 10.3233/JBR-160119. - DOI
    1. Burton-Freeman B.M., Sandhu A.K., Edirisinghe I. Red Raspberries and Their Bioactive Polyphenols: Cardiometabolic and Neuronal Health Links. Adv. Nutr. 2016;7:44–65. doi: 10.3945/an.115.009639. - DOI - PMC - PubMed
    1. Quintanilla A., Mencia A., Powers J., Rasco B., Tang J.M., Sablani S.S. Developing Vacuum-impregnated Dehydrofrozen Red Raspberries with Improved Mechanical Properties. Dry. Technol. 2022;40:299–309. doi: 10.1080/07373937.2020.1789654. - DOI

LinkOut - more resources