. 2025 Aug 2;14(15):2390.
doi: 10.3390/plants14152390.

Raising pH Reduces Manganese Toxicity in Citrus grandis (L.) Osbeck by Efficient Maintenance of Nutrient Homeostasis to Enhance Photosynthesis and Growth

Affiliations

Raising pH Reduces Manganese Toxicity in Citrus grandis (L.) Osbeck by Efficient Maintenance of Nutrient Homeostasis to Enhance Photosynthesis and Growth

Rong-Yu Rao et al. Plants (Basel). .

Abstract

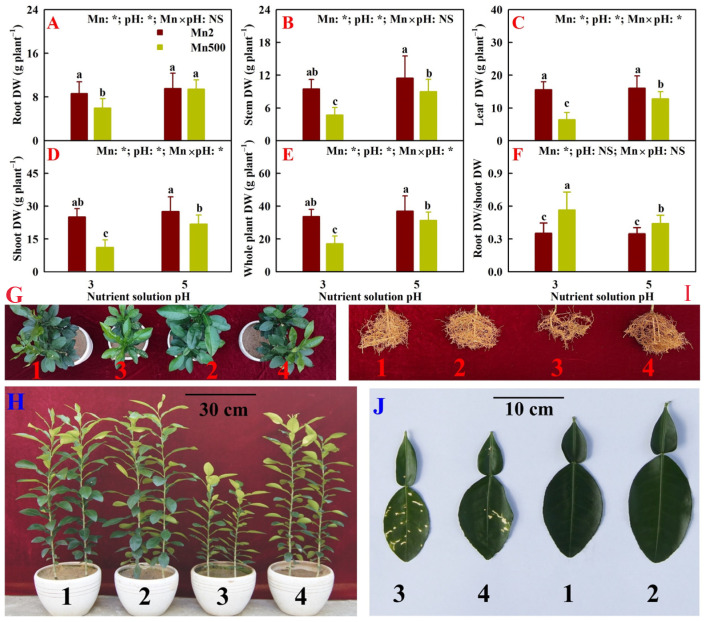
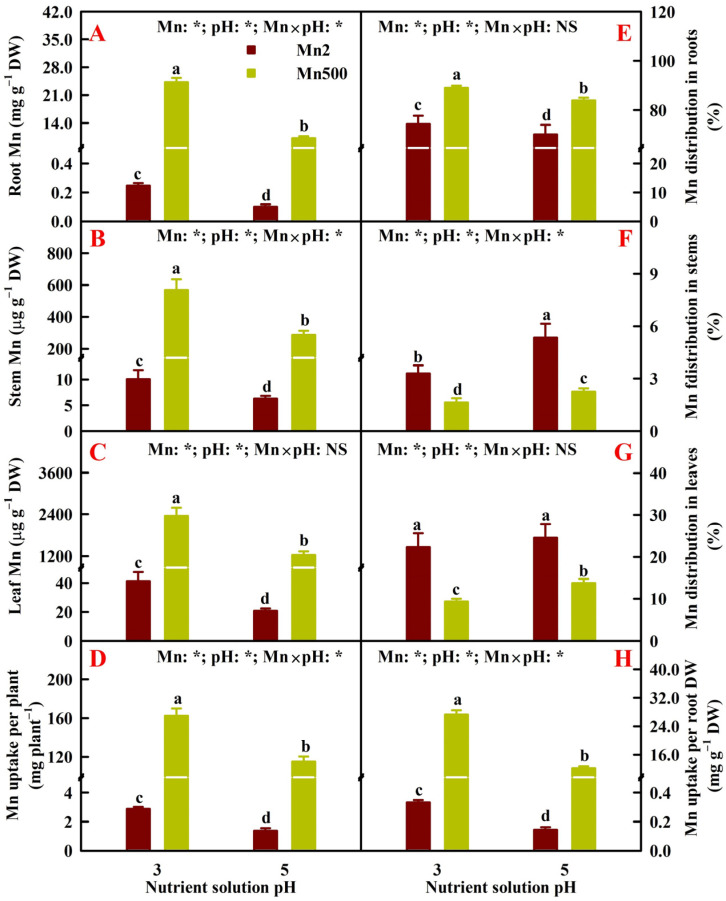
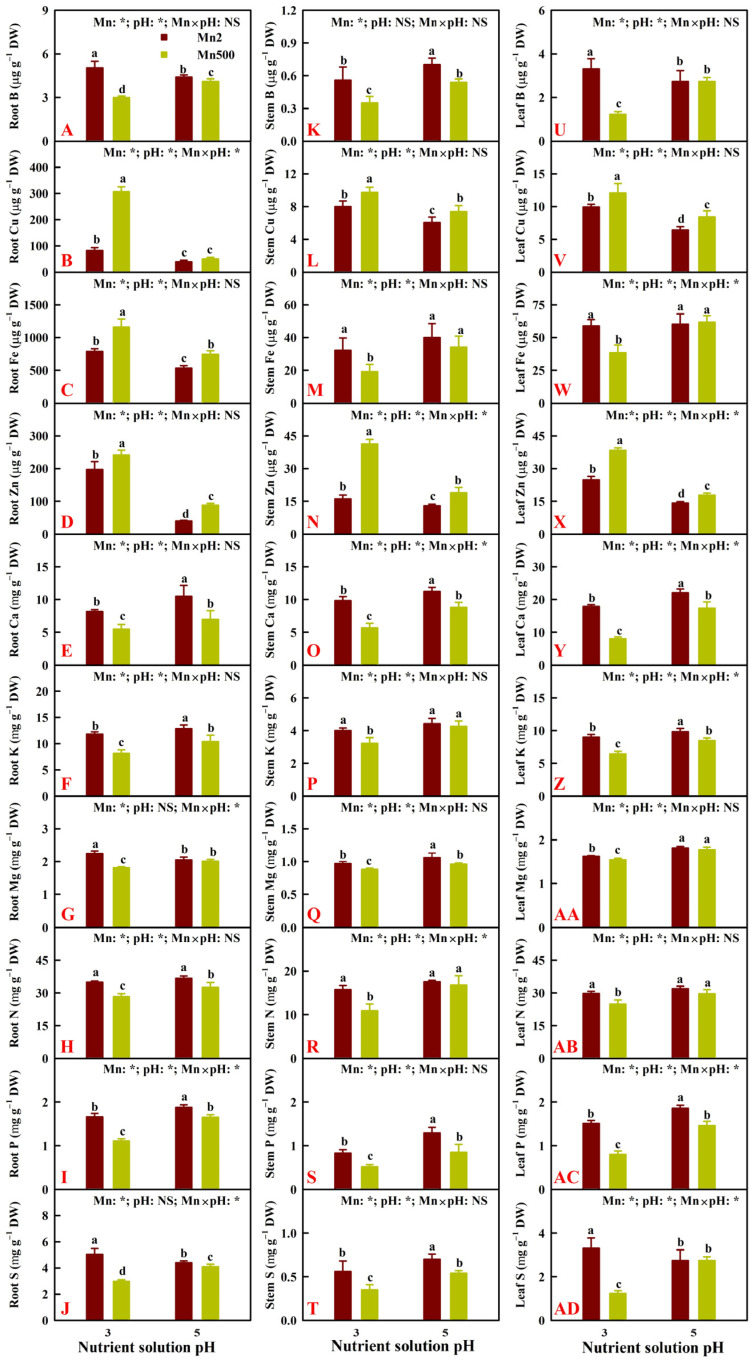
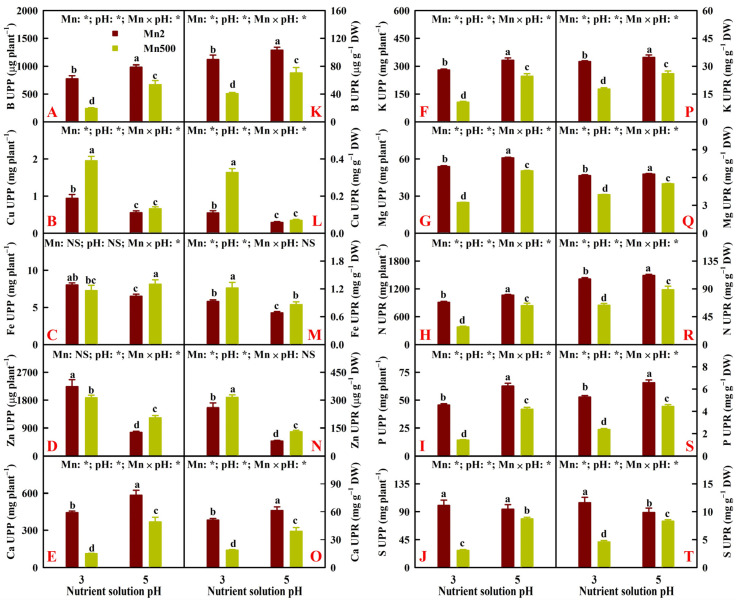
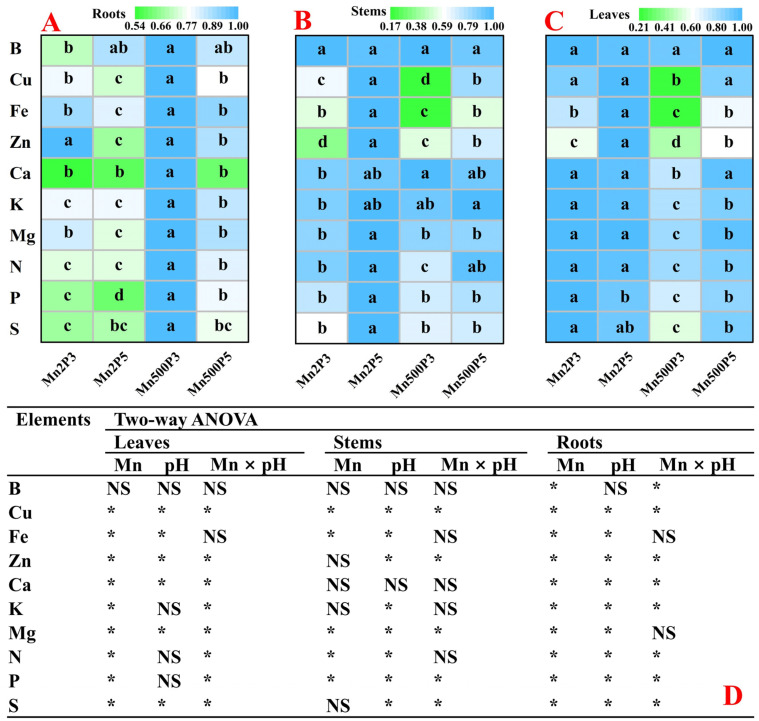
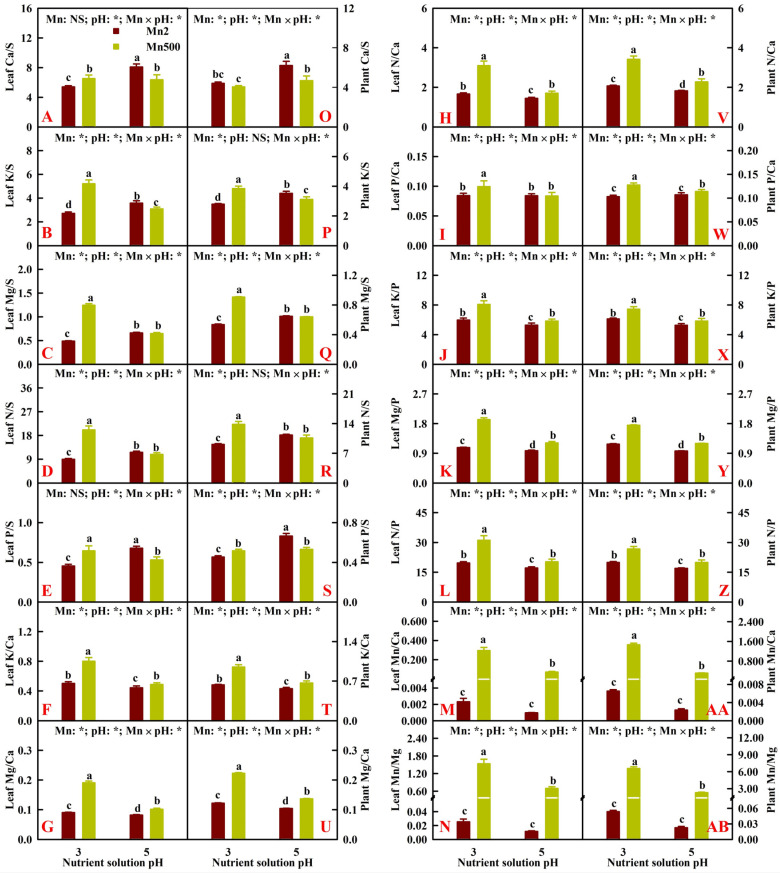
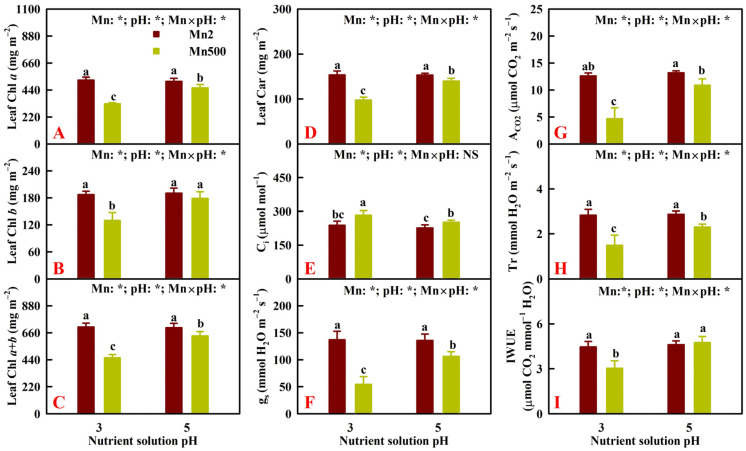
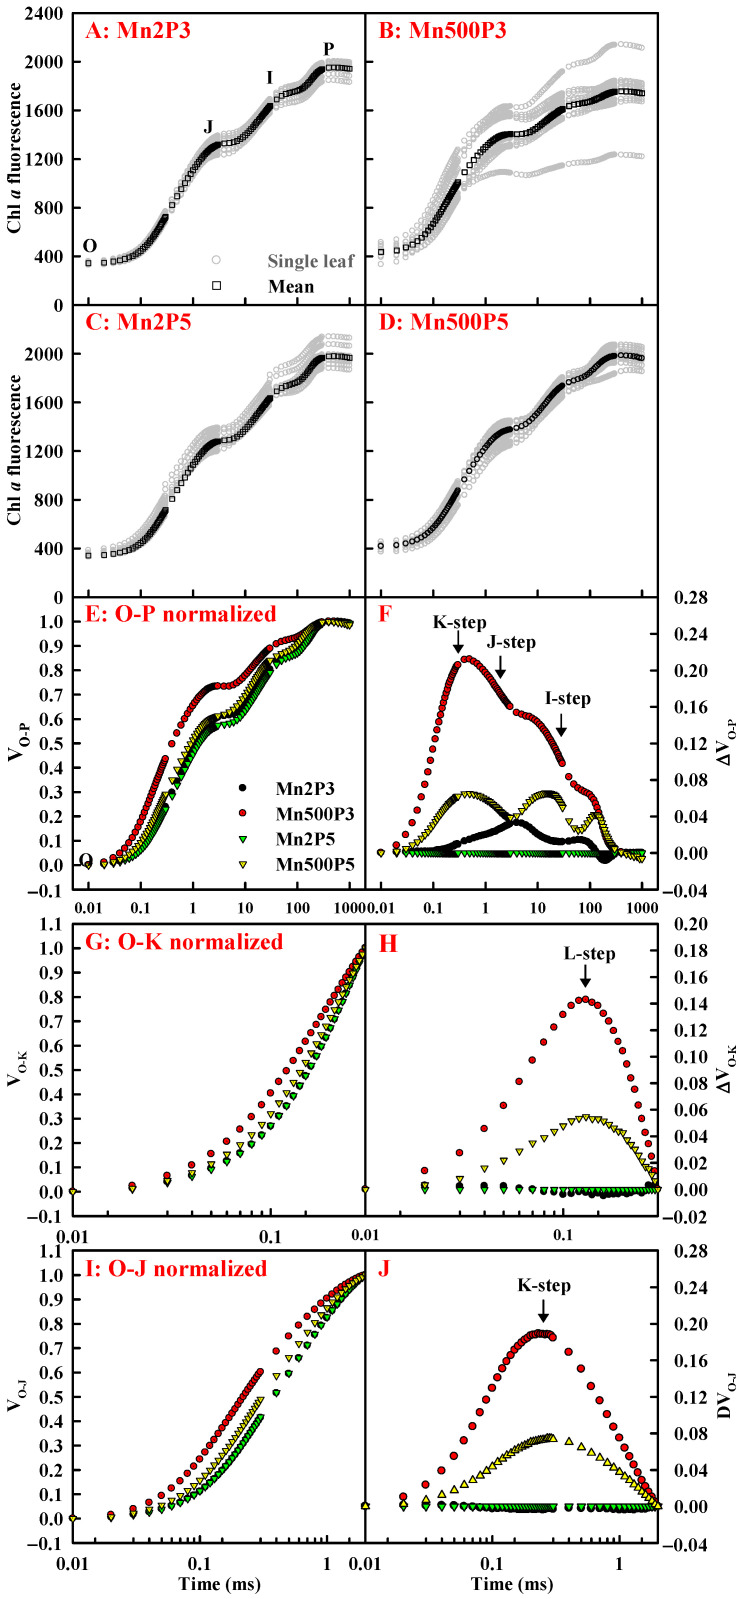
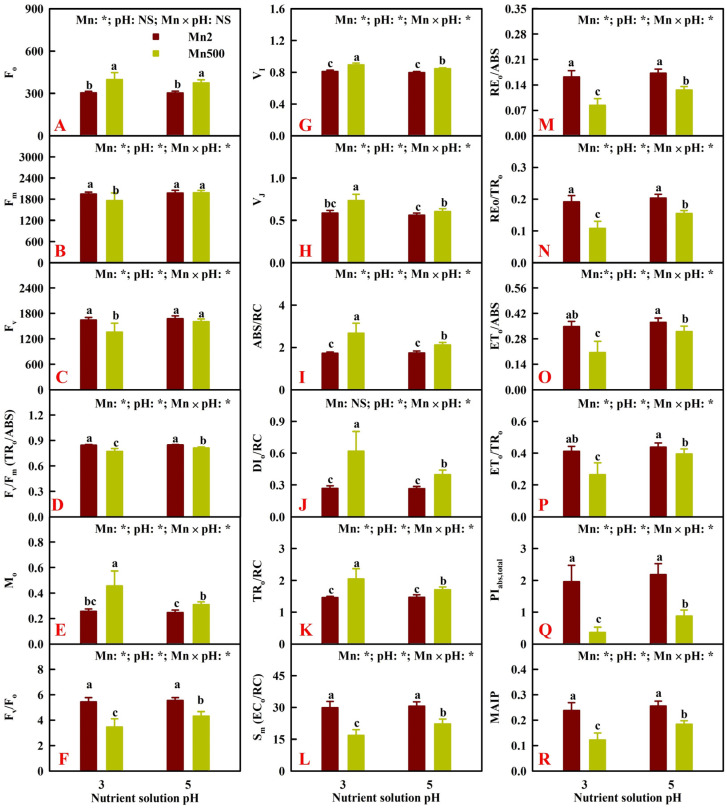
Manganese (Mn) excess and low pH often coexist in some citrus orchard soils. Little information is known about the underlying mechanism by which raising pH reduces Mn toxicity in citrus plants. 'Sour pummelo' (Citrus grandis (L.) Osbeck) seedlings were treated with 2 (Mn2) or 500 (Mn500) μM Mn at a pH of 3 (P3) or 5 (P5) for 25 weeks. Raising pH mitigated Mn500-induced increases in Mn, iron, copper, and zinc concentrations in roots, stems, and leaves, as well as nitrogen, phosphorus, potassium, calcium, magnesium, sulfur, copper, iron, and zinc distributions in roots, but it mitigated Mn500-induced decreases in nitrogen, phosphorus, potassium, calcium, magnesium, sulfur, and boron concentrations in roots, stems, and leaves, as well as nutrient imbalance. Raising pH mitigated Mn500-induced necrotic spots on old leaves, yellowing of young leaves, decreases in seedling growth, leaf chlorophyll concentration, and CO2 assimilation (ACO2), increase in root dry weight (DW)/shoot DW, and alterations of leaf chlorophyll a fluorescence (OJIP) transients and related indexes. Further analysis indicated that raising pH ameliorated Mn500-induced impairment of nutrient homeostasis, leaf thylakoid structure by iron deficiency and competition of Mn with magnesium, and photosynthetic electron transport chain (PETC), thereby reducing Mn500-induced declines in ACO2 and subsequent seedling growth. These results validated the hypothesis that raising pH reduced Mn toxicity in 'Sour pummelo' seedlings by (a) reducing Mn uptake, (b) efficient maintenance of nutrient homeostasis under Mn stress, (c) reducing Mn excess-induced impairment of thylakoid structure and PEPC and inhibition of chlorophyll biosynthesis, and (d) increasing ACO2 and subsequent seedling growth under Mn excess.

Keywords: CO2 assimilation; OJIP transient; manganese excess; nutrient homeostasis; thylakoid structure.


Conflict of interest statement

The authors declare no conflicts of interest. The funders had no role in the design of this study; in the collection, analyses, or interpretation of data; in the writing of the manuscript; or in the decision to publish the results.

Figures

Figure 1
Figure 1
Effects of Mn-pH treatments on the mean (±SD, n = 10) root DW (A), stem DW (B), leaf DW (C), shoot DW (D), whole plant DW (E), and root DW/shoot DW ratio (F), as well as growth (GJ) of ‘Sour pummelo’ seedlings. The bars with different letters indicate significant differences at p ≤ 0.05. pH: NS, and Mn × pH: NS indicate that the F values for pH and Mn × pH are not significant (p > 0.05). Mn: *, pH: *, and Mn × pH: * indicate that the F values for Mn, pH, and Mn × pH are significant at p ≤ 0.05. 1, Mn2 + P3; 2, Mn2 + P5; 3, Mn500 + P3; and 4, Mn500 + P5.
Figure 2
Figure 2
Effects of Mn-pH treatments on the mean (±SD, n = 4) Mn concentrations in roots (A), stems (B), and leaves (C); Mn uptake per plant (UPP, (D)); Mn distributions in roots (E), stems (F), and leaves (G); and Mn uptake per root DW (UPR, (H)) of ‘Sour pummelo’ seedlings. The bars with different letters indicate significant differences at p ≤ 0.05. Mn × pH: NS indicates that the F values for Mn × pH are not significant (p > 0.05). Mn: *, pH: *, and Mn × pH: * indicate that the F values for Mn, pH, and Mn × pH are significant at p ≤ 0.05.
Figure 3
Figure 3
Effects of Mn-pH treatments on the mean (±SD, n = 4) concentrations of B, Cu, Fe, Zn, Ca, K, Mg, N, P, and S in roots (AJ), stems (KT), and leaves (UAD) of ‘Sour pummelo’ seedlings. The bars with different letters indicate significant differences at p ≤ 0.05. pH: NS and Mn × pH: NS indicate that the F values for pH and Mn × pH are not significant (p > 0.05). Mn: *, pH: *, and Mn × pH: * indicate that the F values for Mn, pH, and Mn × pH are significant at p ≤ 0.05.
Figure 4
Figure 4
Effects of Mn-pH treatments on the mean (±SD, n = 4) nutrient uptake per plant (UPP, (AJ)) and uptake per root dry weight (UPR, (KT)). The bars with different letters indicate significant differences at p ≤ 0.05. Mn: NS, pH: NS, and Mn × pH: NS indicate that the F values for Mn, pH, and Mn × pH are not significant (p > 0.05). Mn: *, pH: *, and Mn × pH: * indicate that the F values for Mn, pH, and Mn × pH are significant at p ≤ 0.05.
Figure 5
Figure 5
Heatmaps of the other nutrient distributions in roots (A), stems (B), and leaves (C) under Mn-pH treatments, and two-way ANOVA (D). Results were the means of 4 replicates. For (AC), different letters in the same row for the same tissue indicate a significant difference at p ≤ 0.05. For (D), NS indicates that the F values for Mn, pH, and Mn × pH are not significant (p > 0.05); * indicates that the F values for Mn, pH, and Mn × pH are significant at p ≤ 0.05. Mn2P3, Mn2 + P3; Mn2P5, Mn2 + P5; Mn500P3, Mn500 + P3; Mn500P5, Mn500 + P5.
Figure 6
Figure 6
Effects of Mn-pH treatments on the mean (±SD, n = 4) ratios of Ca, K, Mg, N, and P concentrations to S concentration, K, Mg, N, and P concentrations to Ca concentration, K, Mg, and N concentrations to P concentration, and Mn concentration to Ca and Mg concentrations in leaves (AN), as well as the ratios of Ca, K, Mg, N, and P uptake per plant (UPP) to S UPP, K, Mg, N, and P UPP to Ca UPP, K, Mg, and N UPP to P UPP, and Mn UPP to Ca and Mg UPP (OAB). The bars with different letters indicate significant differences at p ≤ 0.05. Mn: NS and pH: NS indicate that the F values for Mn and pH are not significant (p > 0.05). Mn: *, pH: *, and Mn × pH: * indicate that the F values for Mn, pH, and Mn × pH are significant at p ≤ 0.05.
Figure 7
Figure 7
Effects of Mn-pH treatment on the mean (±SD, n = 4) Chl a (A), Chl b (B), Chl a + b (C), Car (D), Ci (E), gs (F), ACO2 (G), Tr (H), and IWUE (I) in leaves. ACO2, CO2 assimilation; Car, carotenoids; Chl, chlorophyll; Ci, intercellular CO2 concentration; gs, stomatal conductance; IWUE, instantaneous water use efficiency; Tr, transpiration rate. The bars with different letters indicate significant differences at p ≤ 0.05. Mn × pH: NS indicates that the F value for Mn × pH is not significant (p > 0.05). Mn: *, pH: *, and Mn × pH: * indicate that the F values for Mn, pH, and Mn × pH are significant at p ≤ 0.05.
Figure 8
Figure 8
Effects of Mn-pH on OJIP transients of dark-adapted leaves (AD), as well as the mean OJIP transients expressed as the kinetics of relative variable fluorescence: between Fo and Fm (O-P normalized): VO-P = (Ft − Fo)/(Fm − Fo) (E) and the differences of the 4 samples to the reference sample treated with Mn2P5 (ΔVO-P; (F)); between Fo and F300μs (O-K normalized): VO-K = (Ft − Fo)/(F300μ − Fo) (G) and the differences of the 4 samples to the reference sample (ΔVO-K; (H)); and between Fo and FJ (O-J normalized): VO-J = (Ft − Fo)/(FJ − Fo) (I) and the differences of the 4 samples to the reference sample (ΔVO-J; (J)). Ft, fluorescence at time t after onset of actinic illumination; Fo, minimum fluorescence; Fm, maximum fluorescence; F300μs, fluorescence intensity at 300 μs; FJ, fluorescence intensity at the J-step (2 ms).
Figure 9
Figure 9
Effects of Mn-pH treatments on the mean (±SD, n = 10) Fo (A), Fm (B), Fv (C), Fv/Fm or TRo/ABS (D), Mo (E), Fv/Fo (F), VI (G), VJ (H), ABS/RC (I), DIo/RC (J), TRo/RC (K), Sm or ECo/RC (L), REo/ABS (M), REo/TRo (N), ETo/ABS (O), ETo/TRo (P), PIabs,total (Q), and MAIP (R) in leaves. Fv, maximum variable fluorescence; Fv/Fm or TRo/ABS, maximum quantum yield of primary photochemistry; Mo, approximated initial slope (in ms−1) of the fluorescence transient V = f(t); Fv/Fo, maximum primary yield of photochemistry of photosystem II (PSII); VI, relative variable fluorescence at the I-step (30 ms); VJ, relative variable fluorescence at the J-step (2 ms); ABS/RC, absorption flux per reaction center (RC); DIo/RC, dissipated energy flux per reaction center; TRo/RC, trapped energy flux per RC; Sm or ECo/RC, total electron carriers per RC; REo/ABS or φRo, quantum yield for the reduction in end acceptors of photosystem I per photon absorbed; REo/TRo or ρRo, efficiency with which a trapped exciton can move an electron into the electron transport chain from QA to the photosystem I end electron acceptors; ETo/ABS or φEo, quantum yield for electron transport; ETo/TRo or ψEo, probability that a trapped exciton moves an electron into the electron transport chain beyond QA; PIabs,total, total performance index; MAIP, maximum amplitude of IP phase. The bars with different letters indicate significant differences at p ≤ 0.05. pH: NS and Mn × pH: NS indicate that the F values for pH and Mn × pH are not significant (p > 0.05). Mn: *, pH: *, and Mn × pH: * indicate that the F values for Mn, pH, and Mn × pH are significant at p ≤ 0.05.
Figure 10
Figure 10
PCoA plots of 125 parameters for nutrients (33 nutrient concentrations, 11 nutrient UPP, 11 nutrient UPR, 33 nutrient distributions, and 28 ratios), pigments (4), gas exchange (5) (A), 24 parameters for growth (6) and fluorescence (18) (B), and 22 common parameters for roots and leaves (11 nutrient concentrations and 11 nutrient distributions) (C) from ‘Sour pummelo’ seedlings exposed to different Mn-pH treatments. LMn2P3, leaves of seedlings treated with Mn2P3; LMn2P5, leaves of seedlings treated with Mn2P5; LMn500P3, leaves of seedlings treated with Mn500P3; LMn500P5, leaves of seedlings treated with Mn500P5; RMn2P3, roots of seedlings treated with Mn2P3; RMn2P5, roots of seedlings treated with Mn2P5; RMn500P3, roots of seedlings treated with Mn500P3; RMn500P5, roots of seedlings treated with Mn500P5.
Figure 11
Figure 11
Pearson’s correlation coefficient matrix for the mean values of some parameters.

Similar articles

References

    1. Broadley M., Brown P., Cakmak I., Rengel Z., Zhao F. Function of nutrients: Micronutrients. In: Marschner P., editor. Marschner’s Mineral Nutrition of Higher Plants. 3rd ed. Academic; Amsterdam, The Netherlands: 2012. pp. 191–248.
    1. Kochian L.V., Hoekenga O.A., Pineros M.A. How do crop plants tolerate acid soils? Mechanisms of aluminum tolerance and phosphorous efficiency. Annu. Rev. Plant Biol. 2004;55:459–493. doi: 10.1146/annurev.arplant.55.031903.141655. - DOI - PubMed
    1. Zheng Z.-C., Chen H.-H., Yang H., Shen Q., Chen X.-F., Huang W.-L., Yang L.-T., Guo J., Chen L.-S. Citrus sinensis manganese tolerance: Insight from manganese-stimulated secretion of root exudates and rhizosphere alkalization. Plant Physiol. Biochem. 2024;206:108318. doi: 10.1016/j.plaphy.2023.108318. - DOI - PubMed
    1. Wang L., Li J., Liu L., Dong R., Liu G., Rao I.M., Chen Z. Phenylalanine ammonia-lyase 2 regulates secondary metabolism and confers manganese tolerance in Stylosanthes guianensis. Plant Physiol. 2025;197:kiaf005. doi: 10.1093/plphys/kiaf005. - DOI - PubMed
    1. Li J., Jia Y., Dong R., Huang R., Liu P., Li X., Wang Z., Liu G., Chen Z. Advances in the mechanisms of plant tolerance to manganese toxicity. Int. J. Mol. Sci. 2019;20:5096. doi: 10.3390/ijms20205096. - DOI - PMC - PubMed

LinkOut - more resources