. 2025 Aug 4;14(15):2413.
doi: 10.3390/plants14152413.

Drought Modulates Root-Microbe Interactions and Functional Gene Expression in Plateau Wetland Herbaceous Plants

Affiliations

Drought Modulates Root-Microbe Interactions and Functional Gene Expression in Plateau Wetland Herbaceous Plants

Yuanyuan Chen et al. Plants (Basel). .

Abstract

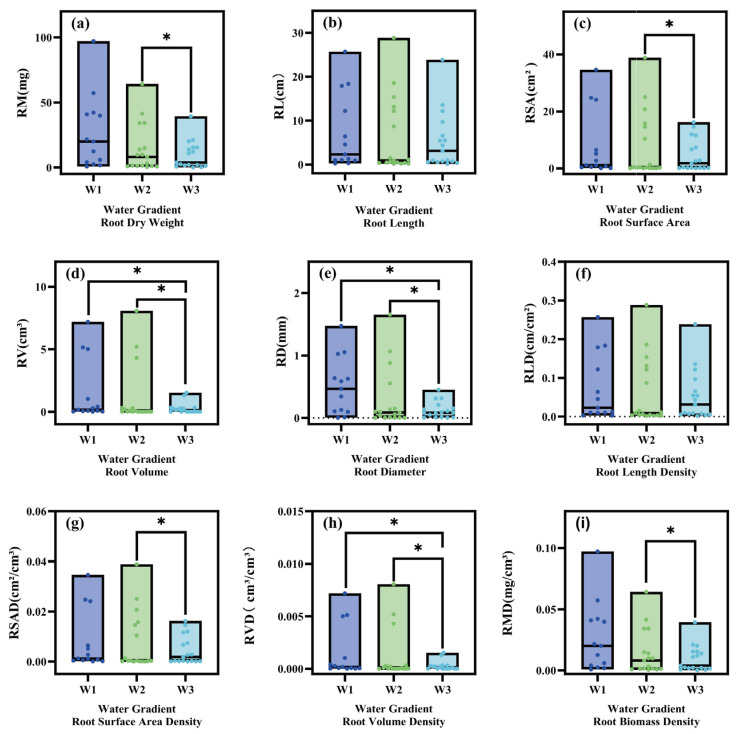
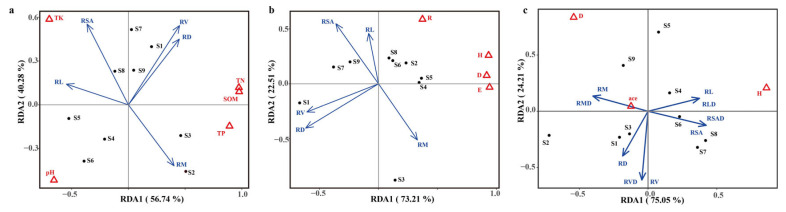
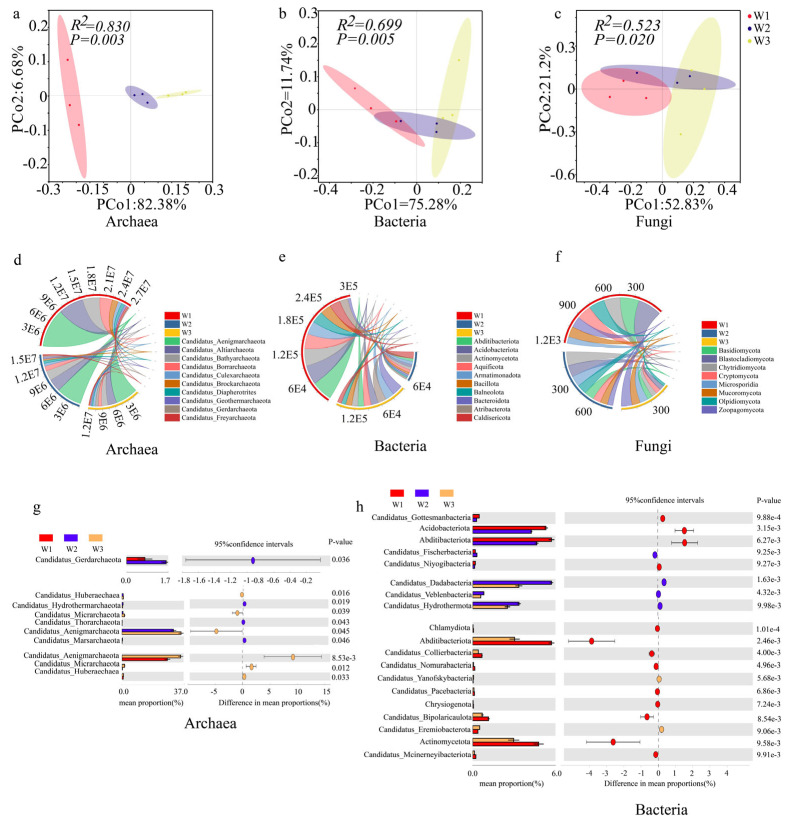
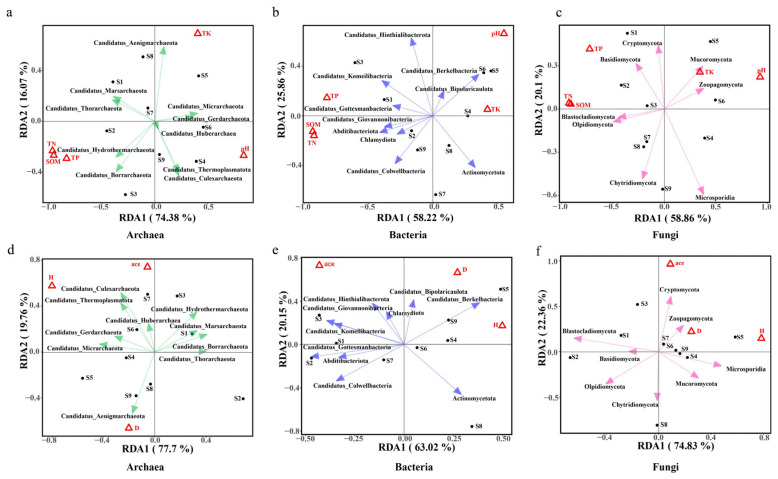
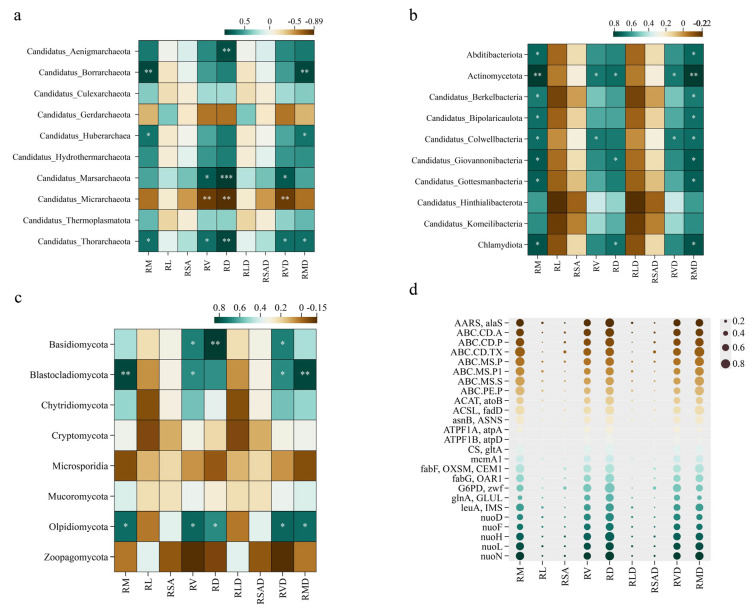
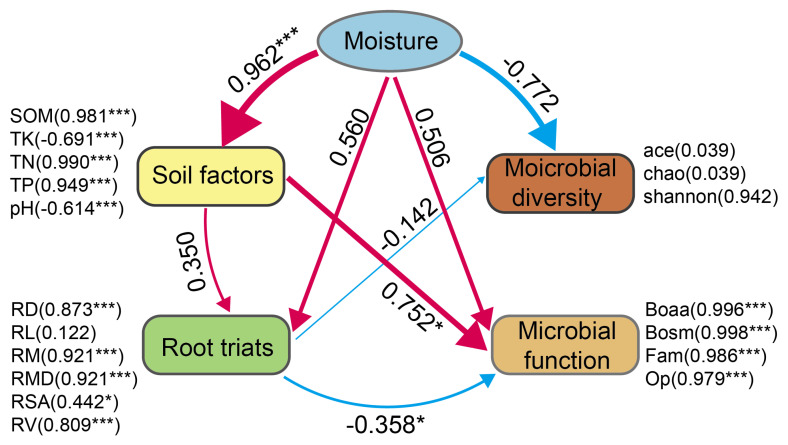
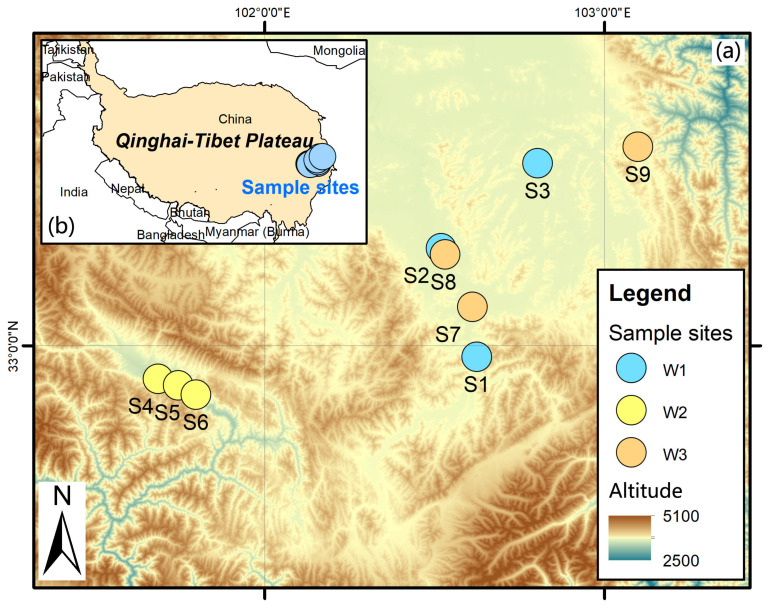
In plateau wetlands, the interactions of herbaceous roots with ectorhizosphere soil microorganisms represent an important way to realize their ecological functions. Global change-induced aridification of plateau wetlands has altered long-established functional synergistic relationships between plant roots and ectorhizosphere soil microbes, but we still know little about this phenomenon. In this context, nine typical wetlands with three different moisture statuses were selected from the eastern Tibetan Plateau in this study to analyze the relationships among herbaceous plant root traits and microbial communities and functions. The results revealed that drought significantly inhibited the accumulation of root biomass and surface area as well as the development of root volumes and diameters. Similarly, drought significantly reduced the diversity of ectorhizosphere soil microbial communities and the relative abundances of key phyla of archaea and bacteria. Redundancy analysis revealed that plant root traits and ectorhizosphere soil microbes were equally regulated by soil physicochemical properties. Functional genes related to carbohydrate metabolism were significantly associated with functional traits related to plant root elongation and nutrient uptake. Functional genes related to carbon and energy metabolism were significantly associated with traits related to plant root support and storage. Key genes such as CS,gltA, and G6PD,zwf help to improve the drought resistance and barrenness resistance of plant roots. This study helps to elucidate the synergistic mechanism of plant and soil microbial functions in plateau wetlands under drought stress, and provides a basis for evolutionary research and conservation of wetland ecosystems in the context of global change.

Keywords: functional genes; moisture status; plant root traits; plant–microbe interactions.


Conflict of interest statement

The authors declare no conflicts of interest.

Figures

Figure 1
Figure 1
Variability in plant root traits of herbaceous plants in different communities. W1: water-rich wetland, W2: water-scarce wetland, W3: aridized wetland; subfigure (a) shows the effect of moisture status on root biomass (RM, mg); subfigure (b) shows the effect of moisture status on root length (RL, cm); subfigure (c) shows the effect of moisture status on root surface area (RSA, cm2); subfigure (d) shows the effect of moisture status on root volume (RV, cm3); subfigure (e) shows the effect of moisture status on root diameter (RD, mm); subfigure (f) shows the effect of moisture status on root length density (RLD, cm/cm3); subfigure (g) shows the effect of moisture status on root surface area density (RSAD, cm2/cm3); subfigure (h) shows the effect of moisture status on root volume density (RVD, cm3/cm3); subfigure (i) shows the effect of moisture status on root biomass density (RMD, mg/cm3); (*: p < 0.05).
Figure 2
Figure 2
Harmonized trade-offs for plant root traits (***: p < 0.001).
Figure 3
Figure 3
RDA plot of factors influencing plant root traits. S1–S9: numbering of nine sample plots with different moisture status, where S1–S3 are water-rich wetlands (W1), S7–S9 are water-scarce wetlands (W2), and S4–S6 are aridized wetlands (W3). (a) RDA plot showing the influence of soil physicochemical properties on plant root trait; (b) RDA plot depicting the influence of plant diversity indices on plant root traits; (c) RDA plot showing the influence of soil microbial diversity indices on plant root traits. RM: root biomass, RL: root length, RSA: root surface area, RV: root volume, RD: root diameter, SOM: soil organic matter; TN: total nitrogen; TP: total phosphorus; TK: total potassium; pH: soil pH; D: Simpson diversity index; H: Shannon‒Wiener diversity index; E: Pielou evenness index; R: species richness index. Arrows indicate the correlation between different influencing factors and plant root traits; longer arrow indicates longer correlation, and the direction of the arrow indicates positive correlation.
Figure 4
Figure 4
PCoA-based soil microbial community structure and its abundance pattern at key phylum level. PCoA: Principal Coordinate Analysis, used to show the similarity of soil microbial community structure in different sites; different colors and shapes of dots represent the sample sites under different moisture status: red is W1, purple is W2, yellow is W3, and the further distance between the dots indicates the greater differences in the microbial community structure; (a) is the PCoA diagram for archaea; (b) is the PCoA diagram for bacteria; (c) is the PCoA diagram for fungi. Chordal plots show the relative abundance of the major phyla of archaea (d), bacteria (e), and fungi (f) under different moisture status: red is W1, blue is W2, yellow is W3;STAMP analysis identifies key taxa and changes in relative abundance of key phyla at the phylum level for archaea (g) and bacteria (h): red is W1, blue is W2, yellow is W3.
Figure 5
Figure 5
Relationship between key phyla of ectorhizosphere soil microorganisms and environmental factors. The figure shows the correlation between key phyla of soil microorganisms and environmental factors through redundancy analysis (RDA). S1–S9: numbering of nine sample plots with different moisture status, where S1–S3 are water-rich wetlands (W1), S7–S9 are water-scarce wetlands (W2), and S4–S6 are aridized wetlands (W3). (a,d) are RDA plots showing the relationships between archaeal key phyla and soil physicochemical properties and soil microbial diversity indices, represented in green; (b,e) are RDA plots showing the relationships between bacterial key phyla and soil physicochemical properties and soil microbial diversity indices, represented in blue; (c,f) are RDA plots showing the relationships between fungal key phyla and soil physicochemical properties and soil microbial diversity indices, represented in pink; Different colored arrows indicate the correlation between environmental factors and microbial phyla, with longer arrows indicating stronger correlations, and arrow direction indicating positive or negative correlations. SOM: soil organic matter; TN: total nitrogen; TP: total phosphorus; TK: total potassium; pH: soil pH; D: Simpson’s diversity index, which is used to measure the diversity of the microbial community. ace: Ace index, used to estimate the species richness of the microbial community. H: Shannon‒Wiener diversity index, used to measure the diversity of the microbial community.
Figure 6
Figure 6
Heat map of correlation between plant root traits and relative abundance of species at the key phylum level and bubble map of key functional genes of significantly related phyla. (a) Heat map displaying the correlation between plant root traits and the relative abundance of species at the key phylum level for Archaea; (b) Heat map showing the correlation between plant root traits and the relative abundance of species at the key phylum level for Bacteria; (c) Heat map illustrating the correlation between plant root traits and the relative abundance of species at the key phylum level for Fungi; (d) Bubble map representing the key functional genes of significantly related phyla. Bubbles vary in size from smallest to largest, representing correlations ranging from 0.2 to 0.8. The heat maps in (ac) use a color scale where blue indicates positive correlations and yellow indicates negative correlations. The bubble map in subfigure d provides a visual representation of the strength and significance of correlations between plant root traits and key functional genes. (*: p < 0.05, **: p < 0.01, ***: p < 0.001).
Figure 7
Figure 7
Structural equation modeling of microbial diversity and functioning. The model revealed indirect effects of moisture status on herbaceous plant root traits and soil microbial functions through soil factors such as soil organic matter—SOM, total nitrogen—TN, total phosphorus—TP, and pH, as well as direct and indirect causal relationships between these factors (model goodness-of-fit—GOF = 0.77). One-way arrows indicate the proposed causal relationships, and path coefficients indicate the strength of these relationships; positive correlations are indicated by red arrows and negative correlations by blue-colored arrows, with the width of the arrow corresponding to the strength of the relationship. In the model, SOM, TN, TP, TK, and pH were the key soil factors affecting plant root traits and microbial function; plant root traits had a significant positive effect on microbial function, and moisture status also directly affected microbial function significantly and positively. (*: p < 0.05, ***: p < 0.001.)
Figure 8
Figure 8
Locations of sample sites. After investigation, we selected nine wetland sample sites with three different moisture statuses: water-rich wetlands (W1), water-scarce wetlands (W2), and aridized wetlands (W3) in the eastern Tibetan Plateau. (a) shows the positions of the sample sites we selected on a small scale; (b) shows the locations of our sampling points on this large scale in the eastern part of the eastern Tibetan Plateau. For soil sampling, we set up a 20 m × 20 m sample square within each sample plot and randomly selected three sampling points in each sample square. Before collecting soil samples, visible plant and animal debris and apomictic material were removed, and then periapical soil was collected from 10 cm × 10 cm clods using a clean shovel and gently swept near the plant roots into a plastic bag. Sampling was avoided in deep water; if shallow water was encountered, it was drained before sampling. Subsequently, three soil samples from each sample plot were thoroughly mixed to make a composite soil sample from which fine roots and larger plant fragments were removed. Finally, the well-mixed soil samples were divided into two portions: one was naturally air-dried for determination of soil nutrient content, and the other was quickly brought back to the laboratory and stored in a −80 °C refrigerator for subsequent microbial sequencing analysis.

Similar articles

References

    1. Chen Y., Lyu X. Research Directions in Wetland Function and Wetland Science. Wetl. Sci. 2003;5:7–11.
    1. Sandi S.G., Rodriguez J.F., Saintilan N., Wen L., Kuczera G., Riccardi G., Saco P.M. Resilience to drought of dryland wetlands threatened by climate change. Sci. Rep. 2020;10:13232. doi: 10.1038/s41598-020-70087-x. - DOI - PMC - PubMed
    1. Liu C., Siri M., Li H., Ren C., Huang J., Feng C., Liu K. Drought is threatening plant growth and soil nutrients of grassland ecosystems: A meta-analysis. Ecol. Evol. 2023;13:e10092. doi: 10.1002/ece3.10092. - DOI - PMC - PubMed
    1. Zhao Z., Zhang Y., Liu L., Liu F., Zhang H. Recent changes in wetlands on the Tibetan Plateau: A review. J. Geogr. Sci. 2015;25:879–896. doi: 10.1007/s11442-015-1208-5. - DOI
    1. Kang D., Chen Y., Feng S., Liu Q., Zou S. Microbial community diversity and assembly processes in the aridification of wetlands on the Qinghai-Tibet Plateau. iScience. 2025;28:112494. - PMC - PubMed

LinkOut - more resources