. 2025 Aug 6;14(15):2433.
doi: 10.3390/plants14152433.

Genome-Wide Identification, Evolution, and Expression Patterns of the Fructose-1,6-Bisphosphatase Gene Family in Saccharum Species

Affiliations

Genome-Wide Identification, Evolution, and Expression Patterns of the Fructose-1,6-Bisphosphatase Gene Family in Saccharum Species

Chunyan Tian et al. Plants (Basel). .

Abstract

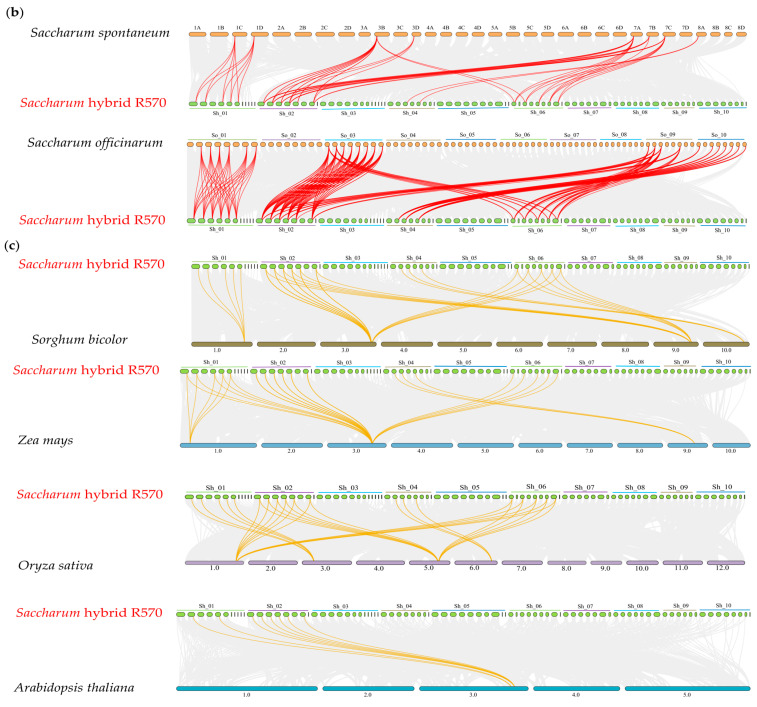
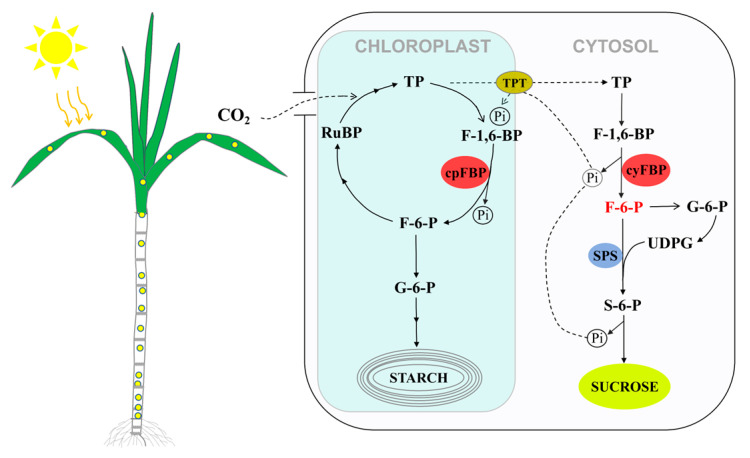
Fructose-1,6-bisphosphatase (FBP) is a crucial regulatory enzyme in sucrose synthesis and photosynthetic carbon assimilation, functioning through two distinct isoforms: cytosolic FBP (cyFBP) and chloroplastic FBP (cpFBP). However, the identification and functional characterization of FBP genes in Saccharum remains limited. In this study, we conducted a systematic identification and comparative genomics analyses of FBPs in three Saccharum species. We further examined their expression patterns across leaf developmental zones, spatiotemporal profiles, and responses to diurnal rhythms and hormonal treatments. Our analysis identified 95 FBP genes, including 44 cyFBPs and 51 cpFBPs. Comparative analyses revealed significant divergence in physicochemical properties, gene structures, and motif compositions between the two isoforms. Expression profiling indicated that both cyFBPs and cpFBPs were predominantly expressed in leaves, particularly in maturing and mature zones. During diurnal cycles, their expression peaked around the night-day transition, with cpFBPs exhibiting earlier peaks than cyFBPs. FBP genes in Saccharum spontaneum displayed greater diurnal sensitivity than those in Saccharum officinarum. Hormonal treatments further revealed significant regulatory divergence in FBP genes, both between isoforms and across species. Notably, cyFBP_2 and cpFBP_2 members consistently exhibited higher expression levels across all datasets, suggesting their pivotal roles in sugarcane physiology. These findings not only identify potential target genes for enhancing sucrose accumulation, but also highlight the breeding value of S. spontaneum and S. officinarum in sugarcane breeding.

Keywords: FBP gene family; Saccharum officinarum; Saccharum spontaneum; expression patterns; functional divergence; genome-wide identification.


Conflict of interest statement

The authors declare no conflicts of interest.

Figures

Figure 1
Figure 1
Phylogenetic tree of FBP proteins. (a) Phylogenetic tree of 127 FBPs from seven species. (b) Phylogenetic tree of 95 FBPs in three Saccharum species. Three cyFBP subgroups were designated as cyFBP_1, cyFBP_2, and cyFBP_3. Consistently, three cpFBP subgroups were designated as cpFBP_1, cpFBP_2, and cpFBP_3. ‘Sspon’ indicates S. spontaneum (AP85-441); ‘LAp’ and ‘Soffic’ indicate S. officinarum (LA-Purple); ‘SoffiXspon’ indicates hybrid R570; ‘LOC_Os’ indicates O. sativa; ‘Sobic’ indicates S. bicolor; ‘Zm’ indicates Z. mays; and ‘AT’ indicates A. thaliana. ‘cyFBPs’ and ‘cpFBPs’ represent the cytosolic FBP genes and chloroplastic FBP genes, respectively. Gene labels with the same color represent FBPs from the same species.
Figure 1
Figure 1
Phylogenetic tree of FBP proteins. (a) Phylogenetic tree of 127 FBPs from seven species. (b) Phylogenetic tree of 95 FBPs in three Saccharum species. Three cyFBP subgroups were designated as cyFBP_1, cyFBP_2, and cyFBP_3. Consistently, three cpFBP subgroups were designated as cpFBP_1, cpFBP_2, and cpFBP_3. ‘Sspon’ indicates S. spontaneum (AP85-441); ‘LAp’ and ‘Soffic’ indicate S. officinarum (LA-Purple); ‘SoffiXspon’ indicates hybrid R570; ‘LOC_Os’ indicates O. sativa; ‘Sobic’ indicates S. bicolor; ‘Zm’ indicates Z. mays; and ‘AT’ indicates A. thaliana. ‘cyFBPs’ and ‘cpFBPs’ represent the cytosolic FBP genes and chloroplastic FBP genes, respectively. Gene labels with the same color represent FBPs from the same species.
Figure 2
Figure 2
Chromosome mapping and collinearity analysis of FBPs. (a) Chromosome mapping and collinearity of FBPs in three Saccharum species. The chromosome number is indicated near each chromosome. Red lines represent syntenic FBP gene pairs, and gray lines are collinear blocks in the genome. The identified FBP genes are shown on the corresponding chromosomes. (b) Syntenic relationships between the hybrid R570, S. spontaneum, and S. officinarum. The chromosome number is indicated at the top or bottom of the chromosome. ‘So’ represents S. officinarum, and ‘Sh’ represents Saccharum hybrid R570. (c) Syntenic maps between R570 and other plant species, including S. bicolor, Z. mays, O. sativa, and A. thaliana. Brown–yellow lines represent syntenic FBP gene pairs, and gray lines are collinear blocks in the genome.
Figure 2
Figure 2
Chromosome mapping and collinearity analysis of FBPs. (a) Chromosome mapping and collinearity of FBPs in three Saccharum species. The chromosome number is indicated near each chromosome. Red lines represent syntenic FBP gene pairs, and gray lines are collinear blocks in the genome. The identified FBP genes are shown on the corresponding chromosomes. (b) Syntenic relationships between the hybrid R570, S. spontaneum, and S. officinarum. The chromosome number is indicated at the top or bottom of the chromosome. ‘So’ represents S. officinarum, and ‘Sh’ represents Saccharum hybrid R570. (c) Syntenic maps between R570 and other plant species, including S. bicolor, Z. mays, O. sativa, and A. thaliana. Brown–yellow lines represent syntenic FBP gene pairs, and gray lines are collinear blocks in the genome.
Figure 3
Figure 3
Comparisons of Ka/Ks, Ka, and Ks values of FBP pairs in three Saccharum species. X-axis shows the three Saccharum species, whereas the Y-axis shows the Ka/Ks ratio, Ka, and Ks. Ss, So, and Sh represent S. spontaneum, S. officinarum, and the Saccharum hybrid R570, respectively.
Figure 4
Figure 4
Expression patterns of FBPs in different leaf segments and three stages. (a) S. spontaneum. (b) S. officinarum. ‘S1-S15’ represents the 15 segments from the base to the tip of the leaf. Stem3, 6, and 9 for S. spontaneum and stem3, 9, and 15 for S. officinarum represent the immature, maturing, and mature stems, respectively. TPM represents transcripts per million. Six subgroups of the FBP family in Saccharum species are indicated on the left of the gene ID.
Figure 5
Figure 5
Expression patterns of FBPs at different time periods based on the TPM value. (a) S. spontaneum. Six subgroups of the FBP family in Saccharum species are indicated on the left of the gene ID. The white boxes at the top of the heatmaps represent light periods, while the black boxes represent dark periods. The corresponding time points are indicated at the bottom of the heatmap. (b) S. officinarum. (c) The expression trendlines of each subgroup in S. Spontaneum and S. officinarum during diurnal cycles. ‘Ss’ and ‘So’ represent S. spontaneum and S. officinarum, respectively. The mean TPM values are shown on the Y-axis, representing the average TPM values of all FBP members within each subgroup. The corresponding time points are displayed on the X-axis.
Figure 5
Figure 5
Expression patterns of FBPs at different time periods based on the TPM value. (a) S. spontaneum. Six subgroups of the FBP family in Saccharum species are indicated on the left of the gene ID. The white boxes at the top of the heatmaps represent light periods, while the black boxes represent dark periods. The corresponding time points are indicated at the bottom of the heatmap. (b) S. officinarum. (c) The expression trendlines of each subgroup in S. Spontaneum and S. officinarum during diurnal cycles. ‘Ss’ and ‘So’ represent S. spontaneum and S. officinarum, respectively. The mean TPM values are shown on the Y-axis, representing the average TPM values of all FBP members within each subgroup. The corresponding time points are displayed on the X-axis.
Figure 6
Figure 6
Expression patterns of FBPs under three hormone treatments in two Saccharum species. (a) S. spontaneum. (b) S. officinarum. The leaves from S. spontaneum and S. officinarum during the seedling stage were treated with ABA, GA, and IAA for 24 h, 48 h, and 96 h, respectively. The heatmaps from left to right represent ABA, GA, and IAA treatments, which are plotted in red and orange colors. ‘C’ represents the control.
Figure 7
Figure 7
Detection of expression levels of FBPs and sucrose content in two sugarcane cultivars. (a) Detection of expression levels of FBPs across five tissues using qRT-PCR. The values on the Y-axis show the relative expression levels. The X-axis shows five tissues collected from the same clones of the cultivars. Different lowercase letters indicate a significant difference (p < 0.05), determined using one-way ANOVA with Tukey’s HSD post hoc test. cyFBP_1, cyFBP_2, cyFBP_3, cpFBP_1, cpFBP_2, and cpFBP_3 indicate the name of detected subgroups, and the representative members in the hybrid R570 are listed in the brackets. (b) Comparison of sucrose content of two cultivars in plant and first ratoon cane. The sucrose content was continuously detected from October 2022 to March 2023 for plant cane and October 2023 to March 2024 for first ratoon cane.
Figure 8
Figure 8
A simplified schematic for the physiological function of FBP in sucrose synthesis of sugarcane (modified from Daie, 1993 [3]). TP: triose phosphate; RuBP: ribulose bisphosphate; F-1,6-BP: fructose-1,6-bisphosphate; F-6-P: fructose-6-bisphosphate; Pi: inorganic phosphate, TPT: triose-P/phosphate translocator; S-6-P: sucrose-6-bisphosphate; G-6-P: glucose-6-bisphosphate; SPS: sucrose phosphate synthase.

Similar articles

References

    1. Marcus F., Gontero B., Harrsch P.B., Rittenhouse J. Amino acid sequence homology among fructose-1,6-bisphosphatases. Biochem. Biophys. Res. Commun. 1986;135:374–381. doi: 10.1016/0006-291X(86)90005-7. - DOI - PubMed
    1. Nel W., Terblanche S.E. Plant fructose-1,6-bisphosphatases: Characteristics and properties. Int. J. Biochem. 1992;24:1267–1283. doi: 10.1016/0020-711X(92)90201-B. - DOI - PubMed
    1. Daie J. Cytosolic fructose-l,6-bisphosphatase_ A key enzyme in the sucrose biosynthetic pathway. Photosynth. Res. 1993;38:5–14. doi: 10.1007/BF00015056. - DOI - PubMed
    1. Koßmann J., Müller-Röber B., Dyer T.A., Raines C.A., Sonnewald U., Willmitzer L. Cloning and expression analysis of the plastidic fructose-l,6-bisphosphatase coding sequence from potato: Circumstantial evidence for the import of hexoses into chloroplasts. Planta. 1992;188:7–12. doi: 10.1007/BF01160706. - DOI - PubMed
    1. Chueca A., Sahrawy M., Pagano E.A., Gorgé J.L. Chloroplast fructose-1,6-bisphosphatase: Structure and function. Photosynth. Res. 2002;74:235–249. doi: 10.1023/A:1021243110495. - DOI - PubMed

LinkOut - more resources