. 2025 Aug 7;14(15):2451.
doi: 10.3390/plants14152451.

Histological and Transcriptomic Insights into Rugose Surface Formation in Pepper (Capsicum annuum L.) Fruit

Affiliations

Histological and Transcriptomic Insights into Rugose Surface Formation in Pepper (Capsicum annuum L.) Fruit

Yiqi Xie et al. Plants (Basel). .

Abstract

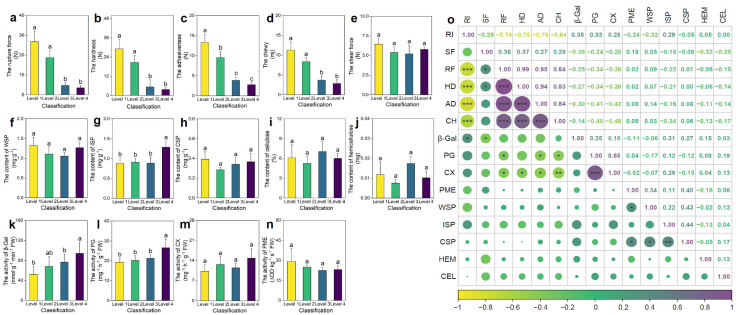
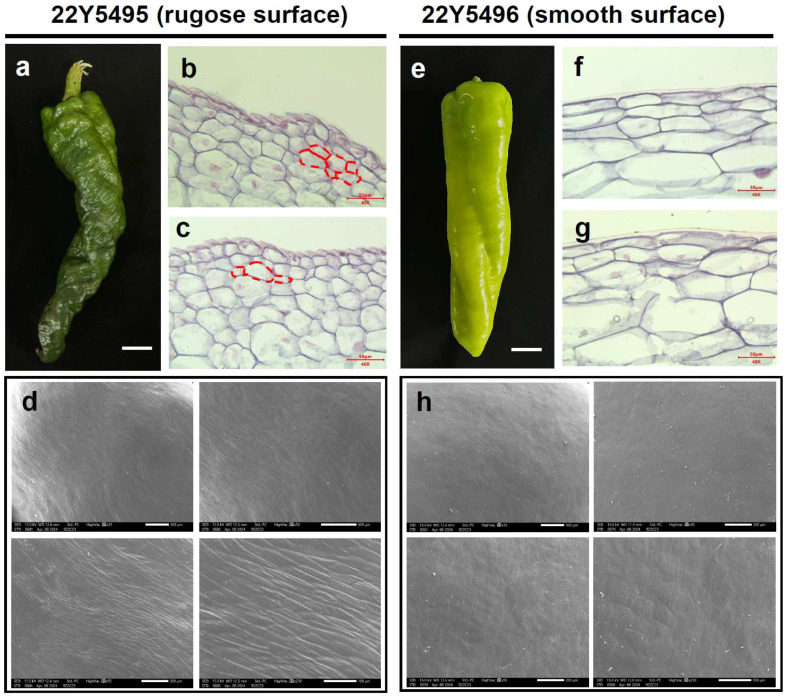
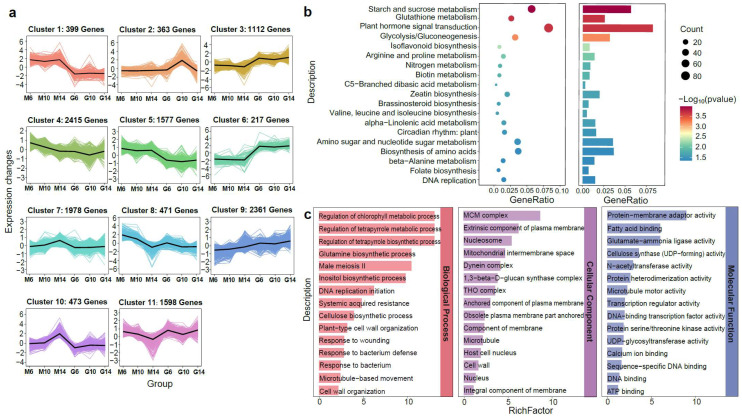
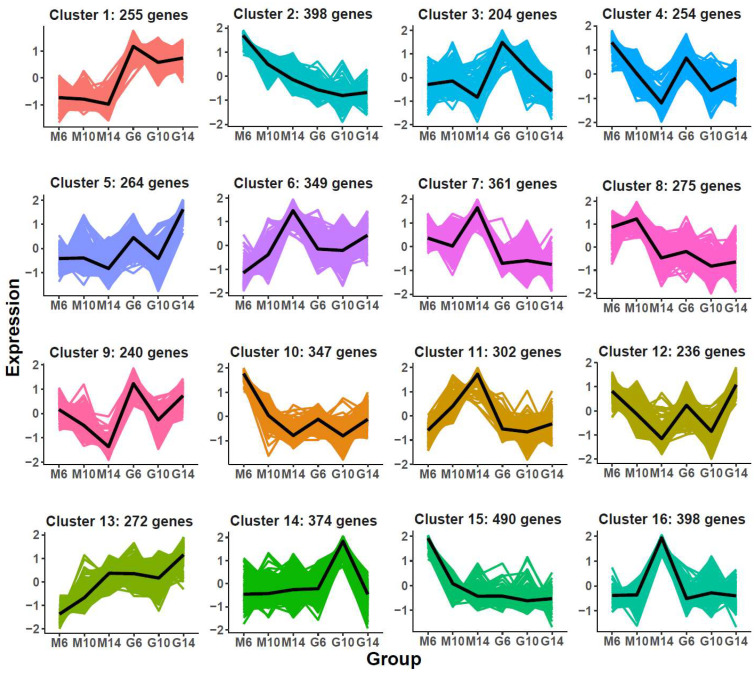
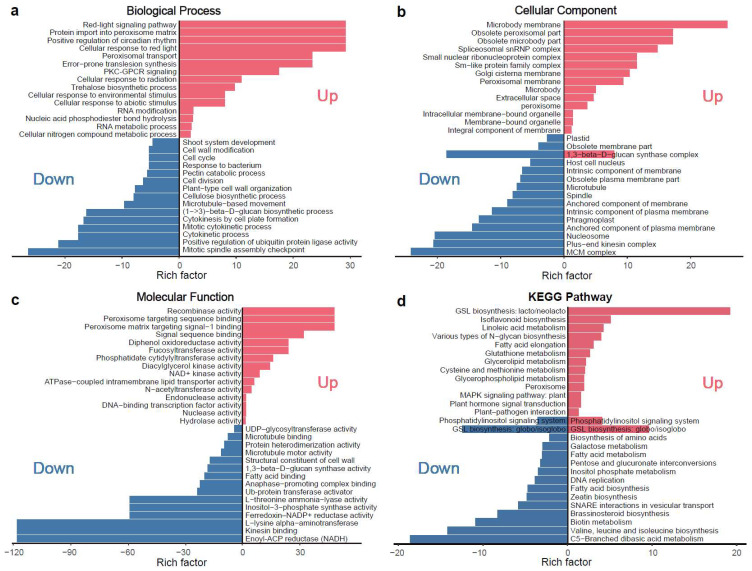
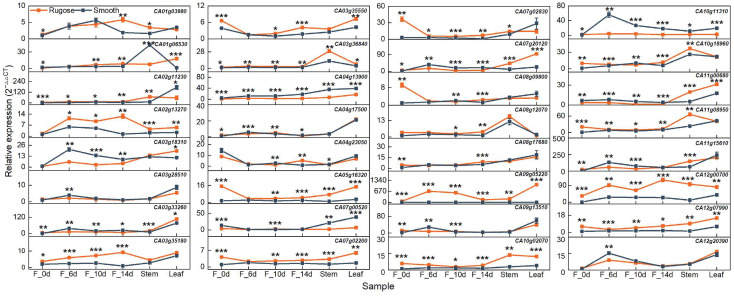
The rugose surface trait in pepper (Capsicum annuum L.), marked by ridges and depressions on the fruit epidermis, is linked to improved fruit texture. To investigate its regulatory basis, histological, textural, and transcriptomic differences, contrasting genotypes were analyzed. Histological analysis revealed that disorganized epidermal cell layers contribute to rugosity, with morphological differences emerging around 10 days post-anthesis (DPA). A computer-aided design (CAD)-based rugosity index (RI) was developed and showed strong correlation with sensory rugosity scores (R2 = 0.659, p < 0.001). Texture analysis demonstrated that increasing surface rugosity was associated with reduced rupture force and hardness, as well as elevated pectinase activity. Comparative transcriptome profiling identified 10 differentially expressed genes (DEGs) related to microtubule dynamics (e.g., CA03g18310 and CA09g13510) and phytohormone signaling (e.g., CA03g35180 and CA08g12070), which exhibited distinct spatial and temporal expression patterns. These findings suggest that coordinated cytoskeletal remodeling and hormonal regulation drive epidermal disorganization, leading to surface rugosity and altered fruit texture. The study provides novel insights into the molecular basis of fruit surface morphology and identifies promising targets for breeding high-quality pepper cultivars.

Keywords: comparative transcriptome analysis; epidermal morphology; fruit surface rugosity; fruit texture; pepper.


Conflict of interest statement

The authors declare no conflicts of interest.

Figures

Figure 1
Figure 1
Differences in pepper fruit texture (ae), cell wall components (fj), and pectinase activity (kn) across different levels of rugose surface classification, along with correlations among the indicators. (a) Rupture force (RF). (b) Hardness (HD). (c) Adhesiveness (AD). (d) Chewiness (CH). (e) Shear force (SF). (f) Water-soluble pectin (WSP) content. (g) Ionically soluble pectin (ISP) content. (h) Covalently soluble pectin (CSP) content. (i) Cellulose (CEL) content. (j) Hemicellulose (HEM) content. (k) β-Galactosidase (β-Gal) activity. (l) Polygalacturonase (PG) activity. (m) Cellulase (CX) activity. (n) Pectin methylesterase (PME) activity. (o) Correlation analysis among all indicators. Data are presented as the mean ± SE (n = 3). The size of the points indicates the strength of the correlation (absolute Pearson’s r), with larger points representing stronger correlations. For (an), different letters indicate statistically significant differences (p < 0.05). For (o), * denotes significance at p < 0.05, ** at p < 0.01, and *** at p < 0.001.
Figure 2
Figure 2
Morphological characteristics of rugose and smooth surface pepper fruits. (a) Pepper fruits from the rugose surface parent “22Y5495” at 30 days post-anthesis. (b,c) The longitudinal section morphological characteristics of rugose surface fruits in the main stage. The red dashed lines indicate the cell layers implicated in the formation of rugose surface. (d) SEM images of rugose surface pepper fruit. (e) Pepper fruits from the smooth surface parent “22Y5496”. (f,g) The longitudinal section morphological characteristics of smooth surface fruits in the main stage. (h) SEM images of smooth surface fruit.
Figure 3
Figure 3
Gene expression and KEGG enrichment analyses during the development of rugose surface and smooth surface pepper fruits based on their accumulation patterns. (a) K-means clustering analysis of gene expression patterns. The x-axis represents the different samples collected from two parental lines (M: rugose; G: smooth) at three developmental stages (6, 10, and 14 days post-anthesis). The y-axis represents the standardized genes expression. The colored areas in the background represent the expression trajectories of individual genes within each cluster, while the bold black line denotes the average expression profile of all genes in the cluster. (b) KEGG pathway enrichment analysis of differentially expressed genes (DEGs) for main cluster based on K-means clustering. (c) GO enrichment analysis of DEGs for main cluster based on K-means clustering.
Figure 4
Figure 4
K-means clustering of differentially expressed genes (DEGs) identified as specific to the developmental process of rugose fruit. The x-axis represents different samples collected from two parental lines (M: rugose; G: smooth) at three developmental stages (6, 10, and 14 days post-anthesis). The y-axis denotes the standardized gene expression levels. The colored areas in the background represent the expression trajectories of individual genes with-in each cluster, while the bold black line denotes the average expression profile of all genes in the cluster.
Figure 5
Figure 5
KEGG pathway and GO enrichment analysis of differentially expressed genes (DEGs) for main cluster based on K-means clustering. (a) Enrichment results for the biological process (BP) category in the GO enrichment analysis. (b) Enrichment results for the cellular component (CC) category in the GO enrichment analysis. (c) Enrichment results for the molecular function (MF) category in the GO enrichment analysis. (d) KEGG enrichment pathway analysis. The red color indicates the enrichment results of upregulated genes, while the blue color indicates the enrichment results of downregulated genes.
Figure 6
Figure 6
Expression profiles of 32 candidate genes across different tissues and developmental stages. The pepper UBIQUITIN (UBI) gene was used as a constitutive control. The relative expression was calculated using the 2−ΔΔCt method. Orange lines represent the rugose surface variety, and blue lines represent the smooth surface variety. Data are shown as the mean ± SE from three technical replicates and three biological replicates. Statistical significance was determined by Student’s t-test: * p < 0.05; ** p < 0.01; and *** p < 0.001. F_0d, ovary; F_6d, fruit at 6 days post-anthesis; F_10d, fruit at 10 days post-anthesis; F_14d, fruit at 14 days post-anthesis.

Similar articles

References

    1. Chaib J., Devaux M.-F., Grotte M.-G., Robini K., Causse M., Lahaye M., Marty I. Physiological Relationships among Physical, Sensory, and Morphological Attributes of Texture in Tomato Fruits. J. Exp. Bot. 2007;58:1915–1925. doi: 10.1093/jxb/erm046. - DOI - PubMed
    1. Cirilli M., Giovannini D., Ciacciulli A., Chiozzotto R., Gattolin S., Rossini L., Liverani A., Bassi D. Integrative Genomics Approaches Validate PpYUC11-like as Candidate Gene for the Stony Hard Trait in Peach (P. persica L. Batsch) BMC Plant Biol. 2018;18:88. doi: 10.1186/s12870-018-1293-6. - DOI - PMC - PubMed
    1. Du X., Davila M., Williams C., Weng Y. Fresh Cucumber Fruit Physicochemical Properties, Consumer Acceptance, and Impact of Variety and Harvest Date. ACS Food Sci. Technol. 2022;2:616–629. doi: 10.1021/acsfoodscitech.1c00433. - DOI
    1. Huang W., Nie Y., Zhu N., Yang Y., Zhu C., Ji M., Wu D., Chen K. Hybrid Label-Free Molecular Microscopies for Simultaneous Visualization of Changes in Cell Wall Polysaccharides of Peach at Single- and Multiple-Cell Levels During Postharvest Storage. Cells. 2020;9:761. doi: 10.3390/cells9030761. - DOI - PMC - PubMed
    1. Shi Y., Li B., Su G., Zhang M., Grierson D., Chen K. Transcriptional Regulation of Fleshy Fruit Texture. JIPB. 2022;64:1649–1672. doi: 10.1111/jipb.13316. - DOI - PubMed

LinkOut - more resources