. 2025 Jul 22;17(15):2395.
doi: 10.3390/nu17152395.

A Refined Carbohydrate-Rich Diet Reduces Vascular Reactivity Through Endothelial Oxidative Stress and Increased Nitric Oxide: The Involvement of Inducible Nitric Oxide Synthase

Affiliations

A Refined Carbohydrate-Rich Diet Reduces Vascular Reactivity Through Endothelial Oxidative Stress and Increased Nitric Oxide: The Involvement of Inducible Nitric Oxide Synthase

Karoline Neumann et al. Nutrients. .

Abstract

Background/objectives: The consumption of refined carbohydrates has increased globally. It is associated with inflammation and oxidative stress, both recognized as risk factors for cardiovascular disease. This study investigated the effects of a refined carbohydrate-rich diet on the vascular reactivity of rat aorta.

Methods: We acclimatized adult male Wistar rats for two weeks and then randomly assigned them to two experimental groups: a control (CT) group and a high-carbohydrate diet (HCD) group. The CT group received standard laboratory chow for 15 days, while the HCD group received a diet composed of 45% sweetened condensed milk, 10% refined sugar, and 45% standard chow. After the dietary exposure period, we evaluated the vascular reactivity of aortic rings, gene expression related to inflammation, superoxide dismutase activity, and biochemical parameters, including cholesterol, triglycerides, fasting glucose, and glucose and insulin tolerance.

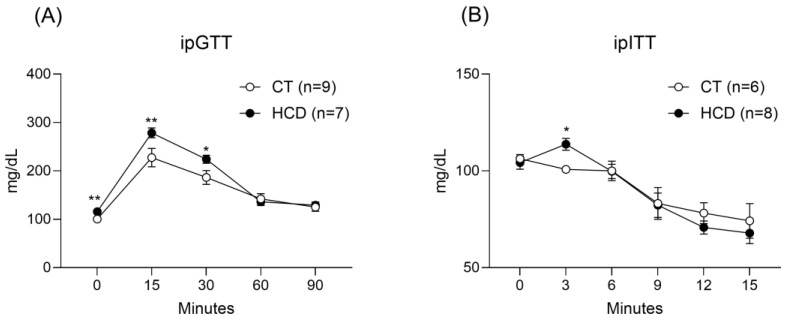
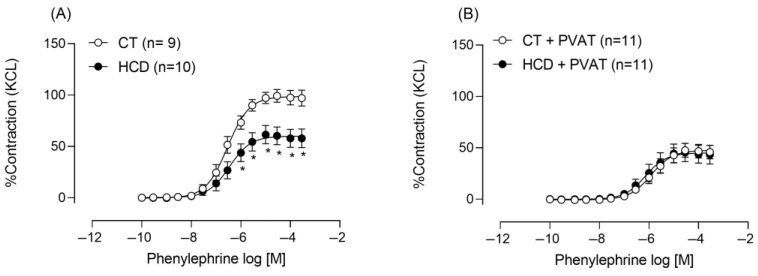
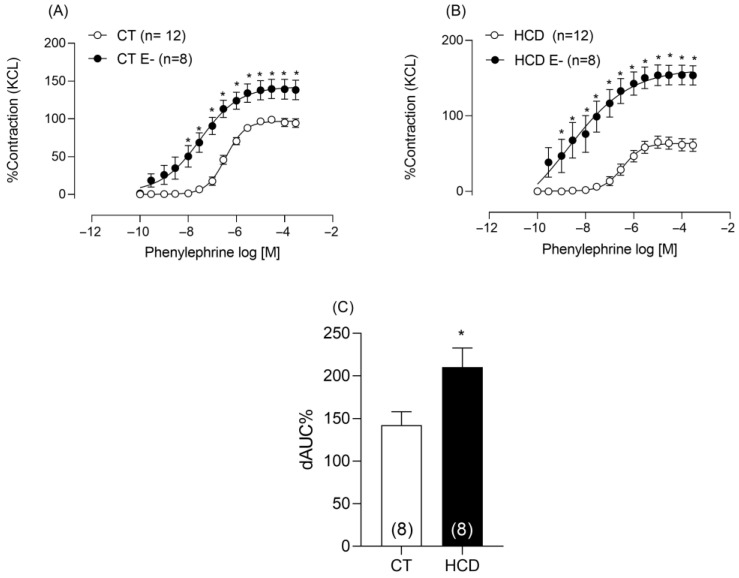
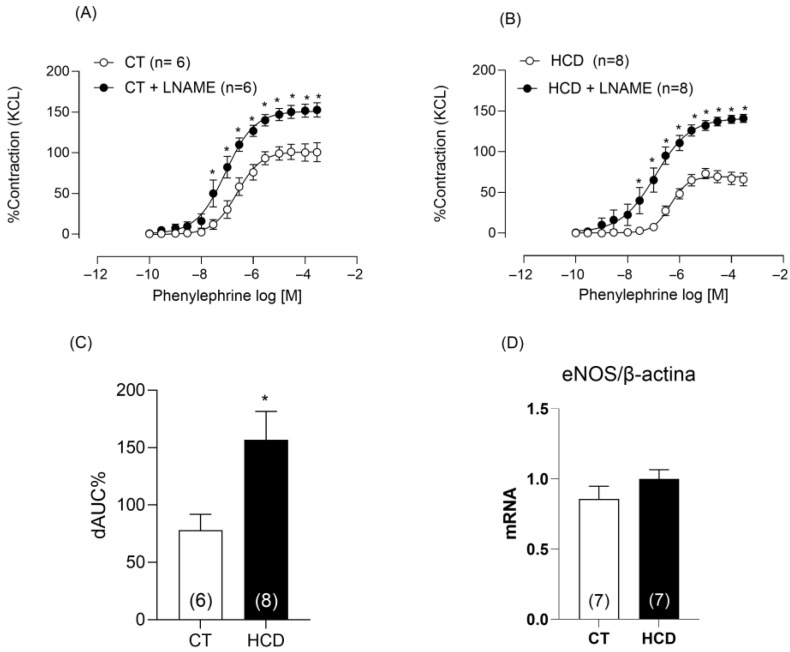
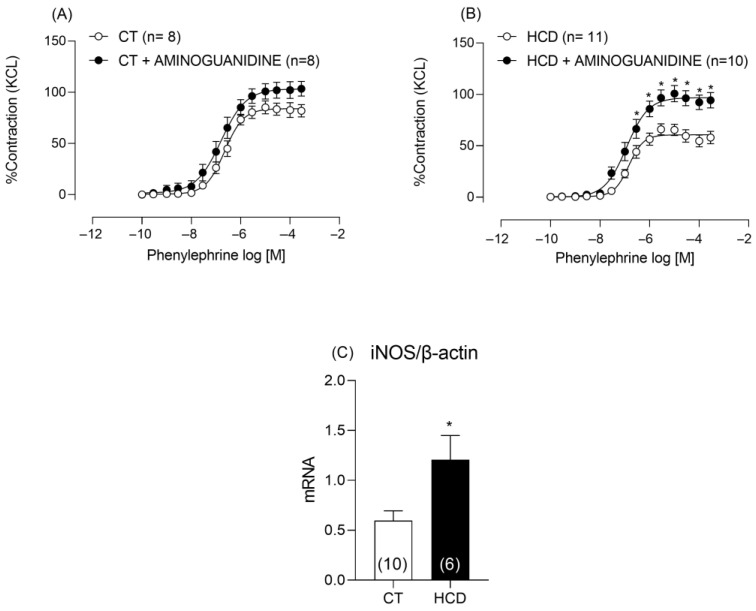
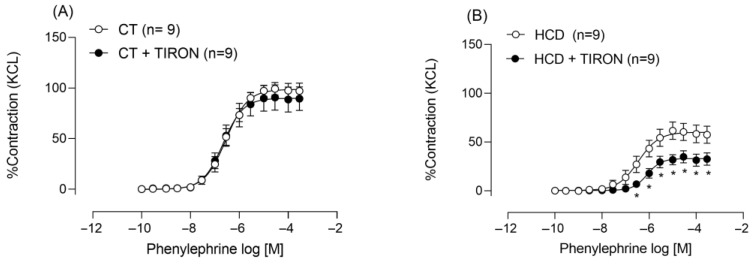
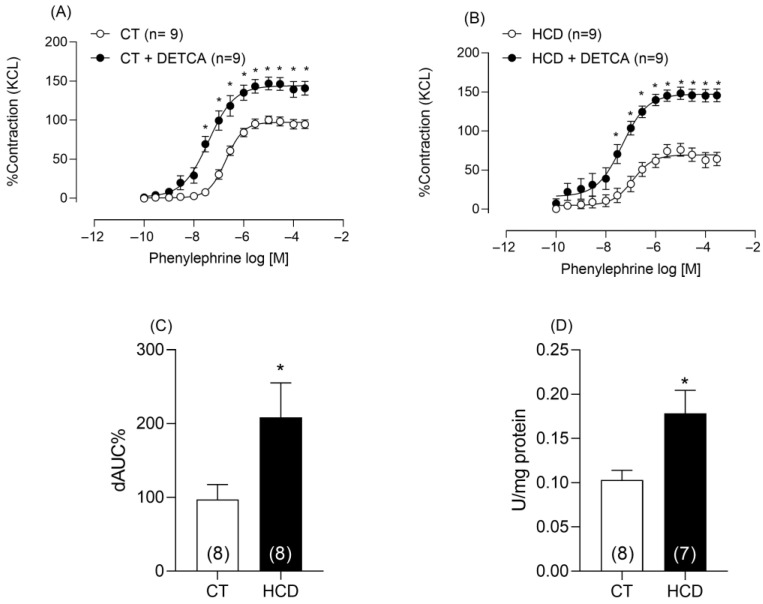
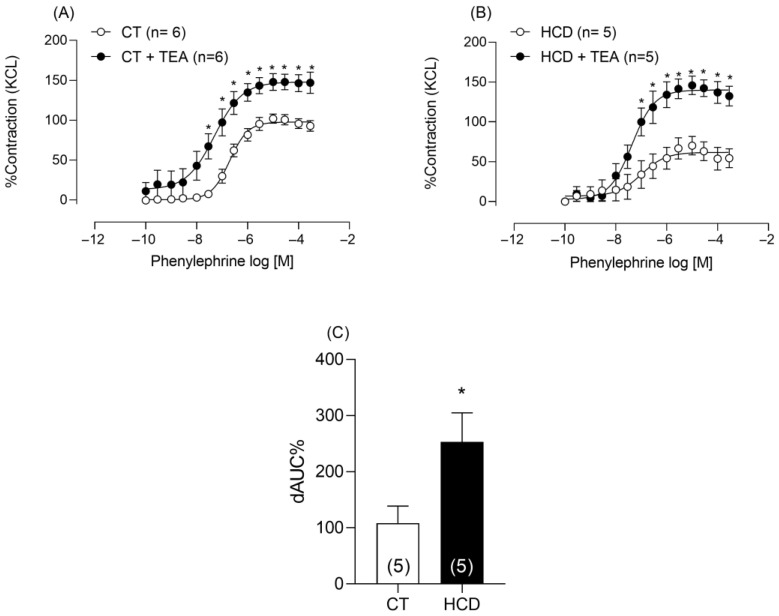
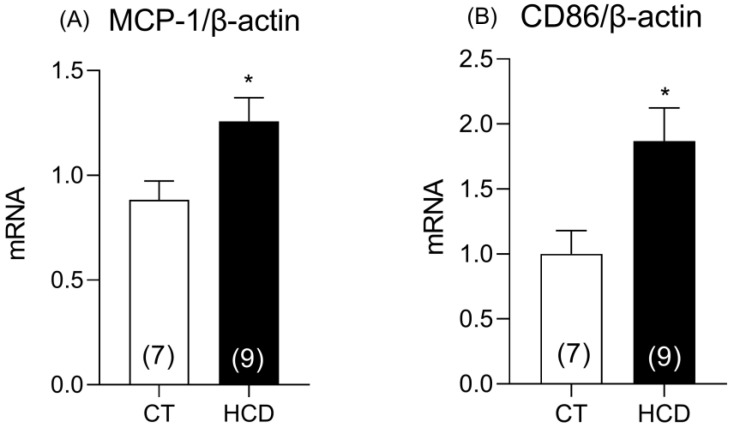
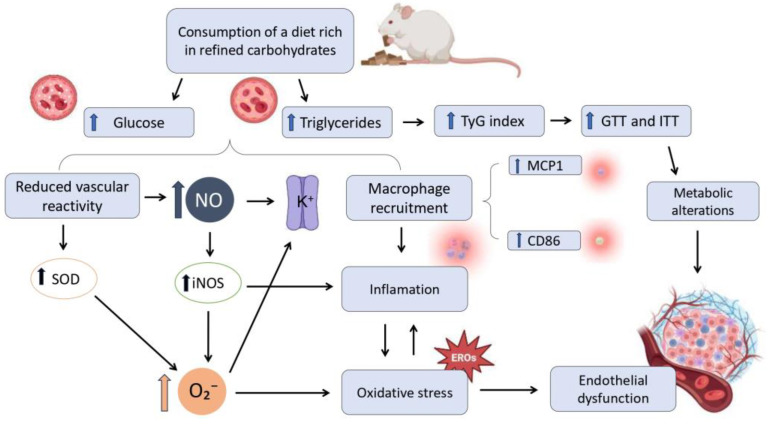
Results: The results demonstrate a reduction in vascular reactivity caused by endothelial alterations, including increased NO production, which was observed as higher vasoconstriction in the presence of L-NAME and aminoguanidine and upregulation of iNOS gene expression. In addition, increased production of free radicals, such as O2-, was observed, as well as immune markers like MCP-1 and CD86 in the HCD group. Additionally, the HCD group showed an increase in the TyG index, suggesting early metabolic impairment. GTT and ITT results revealed higher glycemic levels, indicating early signs of insulin resistance.

Conclusions: These findings indicate that short-term consumption of a refined carbohydrate-rich diet may trigger oxidative stress and endothelial dysfunction, thereby increasing the risk of cardiovascular complications.

Keywords: aorta; inflammation; oxidative stress; refined carbohydrate-rich diet; vascular reactivity.


Conflict of interest statement

The authors declare no conflicts of interest that could have influenced the work reported in this article.

Figures

Figure 1
Figure 1
Evaluation of glucose metabolism. GTT (A) and ITT (B) in Wistar rats treated for 15 days with a control diet (CT) or a refined carbohydrate-rich diet (HCD). Data are expressed as mean ± SEM. * p < 0.05 vs. CT. ** p < 0.01 vs. CT. Student’s t-test was used. The number of animals is indicated in parentheses.
Figure 2
Figure 2
Concentration–response curves to phenylephrine (Phe) in thoracic aorta rings with (A) and without (B) the presence of PVAT. Each point represents the mean ± SEM. * p < 0.05, HCD vs. CT. The 95% CI = (CT: 93.27 to 104.6; HCD: 53.58 to 67.85). Two-way ANOVA followed by Bonferroni post hoc test. The number of animals is indicated in parentheses.
Figure 3
Figure 3
Effects of endothelium removal (E–) on Phe-induced vasoconstriction in aortic rings from CT (A) and HCD (B) groups. Each point represents the mean ± SEM. * p < 0.05, HCD vs. CT. The 95% CI = (CT:92.92 to 101.1; CT É-: 129.8 to 165.7; HCD: 57.7 to 70.0; HCD É-: Two-way ANOVA followed by Bonferroni post hoc test. (C) Percentage difference in the area under the concentration–response curve to phenylephrine (ΔAUC) for comparison between groups. Student’s t-test was used. * p < 0.05, HCD vs. CT. The number of animals is indicated in parentheses.
Figure 4
Figure 4
Effects of L-NAME on Phe-induced vasoconstriction. Effects of L-NAME (100 µM) on vasoconstriction in aortic rings from CT (A) and HCD (B) groups. Each point represents the mean ± SEM. * p < 0.05. HCD vs. CT. The 95% CI (CT: 93.57 to 110.0; CT + LNAME: 142.5 to 161.0; HCD: 64.48 to 74.29; HCD + LNAME: 130.5 to 165.7). Two-way ANOVA followed by Bonferroni post-test. (C) Percentage difference in the area under the concentration–response curve to phenylephrine (ΔAUC) for comparison between groups. (D) Messenger RNA concentration of eNOS. Student’s t-test was used on ΔAUC%. * p < 0.05, HCD vs. CT. The number of animals is indicated in parentheses.
Figure 5
Figure 5
Effects of aminoguanidine (50 µM) on Phe-induced vasoconstriction and messenger RNA concentration of iNOS. Effects of aminoguanidine (50 Μm) on vasoconstriction in aortic rings from CT (A) and HCD (B) groups. Each point represents the mean ± SEM. * p < 0.05. HCD vs. CT. The 95% CI = (CT: 79.56 to 88.72; CT + AMINOGUANIDE: 96.32 to 111.4; HCD: 56.93 to 64.39; HCD + AMINOGUANIDINE: 91.12 to 102.9). Two-way ANOVA followed by Bonferroni post-test. (C) Messenger RNA concentration of iNOS. Data are expressed as mean ± SEM. * p < 0.05 HCD vs. CT. Student’s t-test was used. The number of animals used is indicated in parentheses.
Figure 6
Figure 6
Effects of Tiron on Phe-induced vasoconstriction. Effects of Tiron (1 mM) on vasoconstriction in aortic rings from CT (A) and HCD (B) groups. Each point represents the mean ± SEM. * p < 0.05. HCD vs. CT. The 95% CI = (CT: 93.27 to 104.6; CT + TIRON: 81.71 to 99.4; HCD: 53.6 to 67.93; HCD + TIRON: 29.28 to 37.23). Two-way ANOVA followed by Bonferroni post-test. The number of animals used is indicated in parentheses.
Figure 7
Figure 7
Effects of DETCA on Phe-induced vasoconstriction and SOD activity. Effects of DETCA (0.5µM) on vasoconstriction in aortic rings from CT (A) and HCD (B) groups. (D) SOD activity. Each point represents the mean ± SEM. * p < 0.05. HCD vs. CT. Two-way ANOVA followed by Bonferroni post-test. (C) Percentage difference in the area under the concentration–response curve to phenylephrine (ΔAUC) for comparison between groups. (D) SOD activity. T-test was used on ΔAUC% * p < 0.05. HCD vs. CT. The number of animals used is indicated in parentheses.
Figure 8
Figure 8
Effects of catalase on Phe-induced vasoconstriction. Effects of catalase (1000 U/mL−1) on vasoconstriction in aortic rings from CT (A) and HCD (B) groups. Each point represents the mean ± SEM. HCD vs. CT. Two-way ANOVA followed by Bonferroni post-test. The number of animals used is indicated in parentheses.
Figure 9
Figure 9
Effects of TEA on Phe-induced vasoconstriction. Effects of the nonselective K+ channel blocker, TEA (2 mM), on vasoconstriction in aortic rings from CT (A) and HCD (B) groups. Each point represents the mean ± SEM. * p < 0.05. HCD vs. CT. Two-way ANOVA followed by Bonferroni post-test. (C) Percentage difference in the area under the concentration–response curve to phenylephrine (ΔAUC) for comparison between groups. T-test was used on ΔAUC% * p < 0.05. HCD vs. CT. The number of animals used is indicated in parentheses.
Figure 10
Figure 10
Regulation of inflammation-related genes. Concentration of messenger RNA, monocyte chemoattractant protein-1 MCP-1 (A), and CD86 (B). Data are expressed as mean ± SEM. * p < 0.05 vs. CT. The 95% CI = (MCP-1: 0.054 to 0.69; CD86: 0.16 to 1.57). The number of animals used is indicated in parentheses. * p < 0.05 HCD vs. CT. Student’s t-test was used.
Figure 11
Figure 11
Schematic representation of the proposed mechanisms by which short-term consumption of a refined carbohydrate-rich diet impairs vascular function and metabolism. The consumption of a refined carbohydrate-rich diet leads to increased circulating levels of glucose and triglycerides. This increase is associated with a rise in the TyG index (triglycerides and glucose), a marker widely used to estimate insulin resistance. Consequently, there is a worsening in glucose tolerance (GTT) and insulin tolerance (ITT) tests, indicating the presence of significant metabolic alterations that contribute to endothelial dysfunction.

Similar articles

References

    1. Arnone D., Chabot C., Heba A.-C., Kökten T., Caron B., Hansmannel F., Dreumont N., Ananthakrishnan A.N., Quilliot D., Peyrin-Biroulet L. Sugars and Gastrointestinal Health. Clin. Gastroenterol. Hepatol. 2022;20:1912–1924.e7. doi: 10.1016/j.cgh.2021.12.011. - DOI - PubMed
    1. Azais-Braesco V., Sluik D., Maillot M., Kok F., Moreno L.A. A review of total & added sugar intakes and dietary sources in Europe. Nutr. J. 2017;16:6. doi: 10.1186/s12937-016-0225-2. - DOI - PMC - PubMed
    1. Witek K., Wydra K., Filip M. A high-sugar diet consumption, metabolism and health impacts with a focus on the development of substance use disorder: A narrative review. Nutrients. 2022;14:2940. doi: 10.3390/nu14142940. - DOI - PMC - PubMed
    1. World Health Organization Cardiovascular Diseases (CVDs) [(accessed on 17 February 2024)]. Available online: https://www.who.int/news-room/fact-sheets/detail/cardiovascular-diseases...
    1. Zhang Y., Giovannucci E.L. Ultra-processed foods and health: A comprehensive review. Crit. Rev. Food Sci. Nutr. 2022;63:10836–10848. doi: 10.1080/10408398.2022.2084359. - DOI - PubMed

LinkOut - more resources