

A Low-Sugar Flavored Beverage Improves Fluid Intake in Children During Exercise in the Heat
- PMID: 40806001
- PMCID: PMC12348641
- DOI: 10.3390/nu17152418
A Low-Sugar Flavored Beverage Improves Fluid Intake in Children During Exercise in the Heat
Abstract
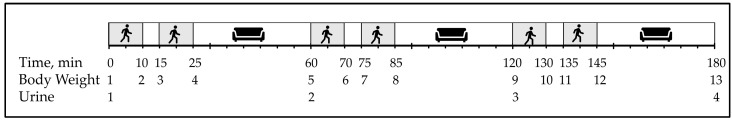
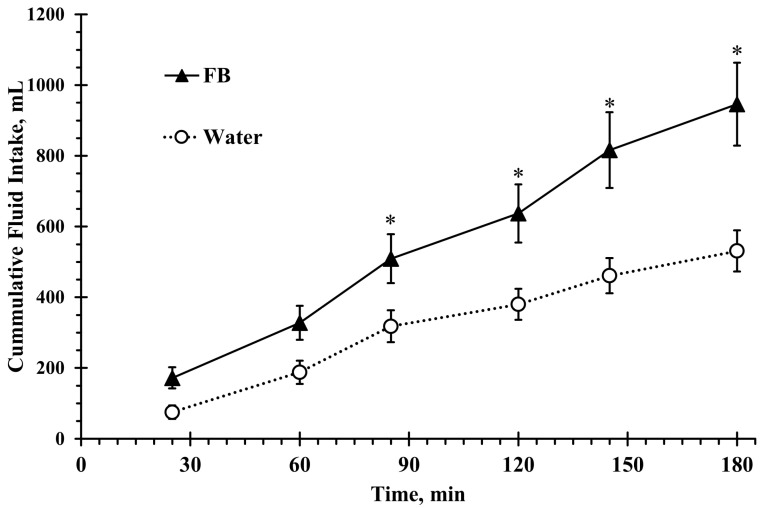
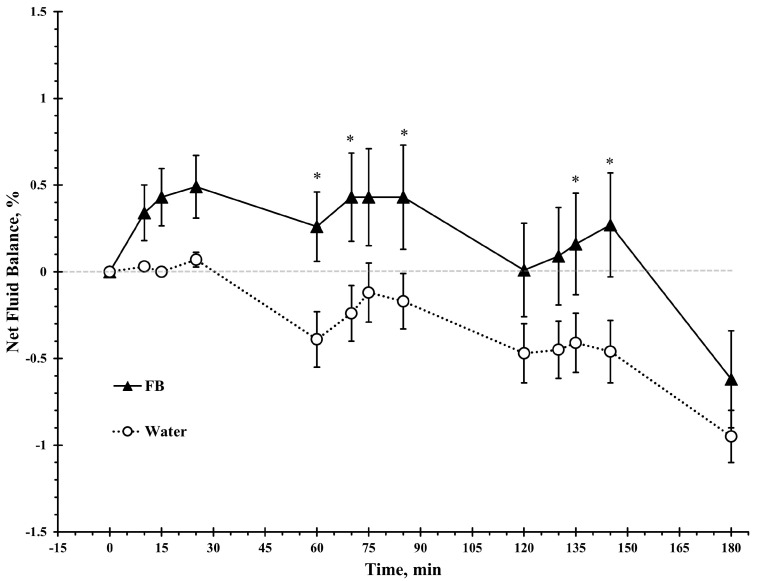
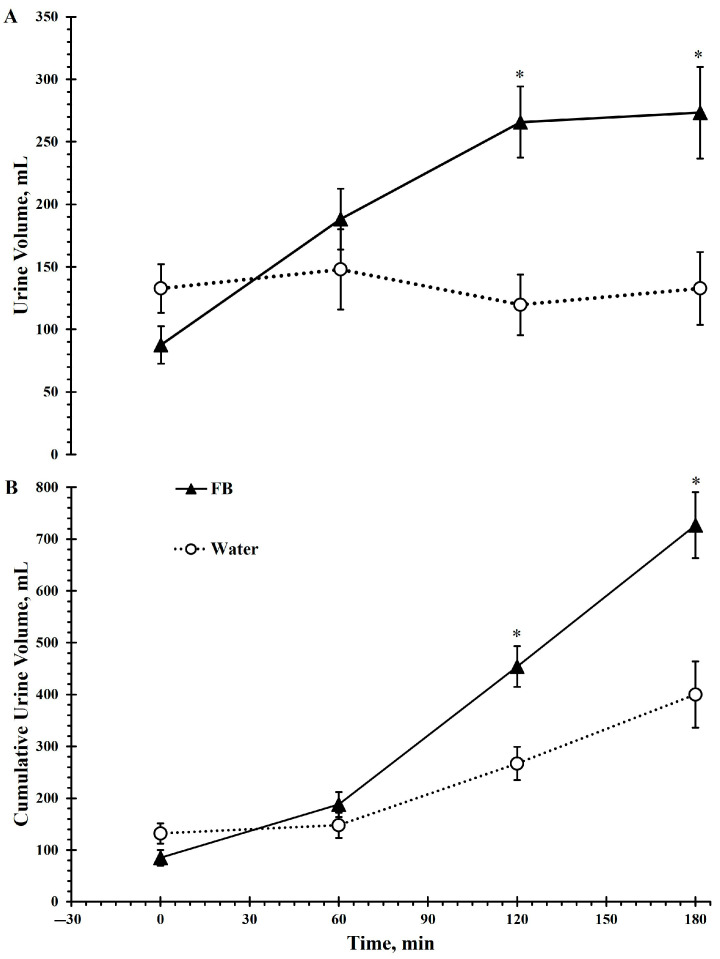
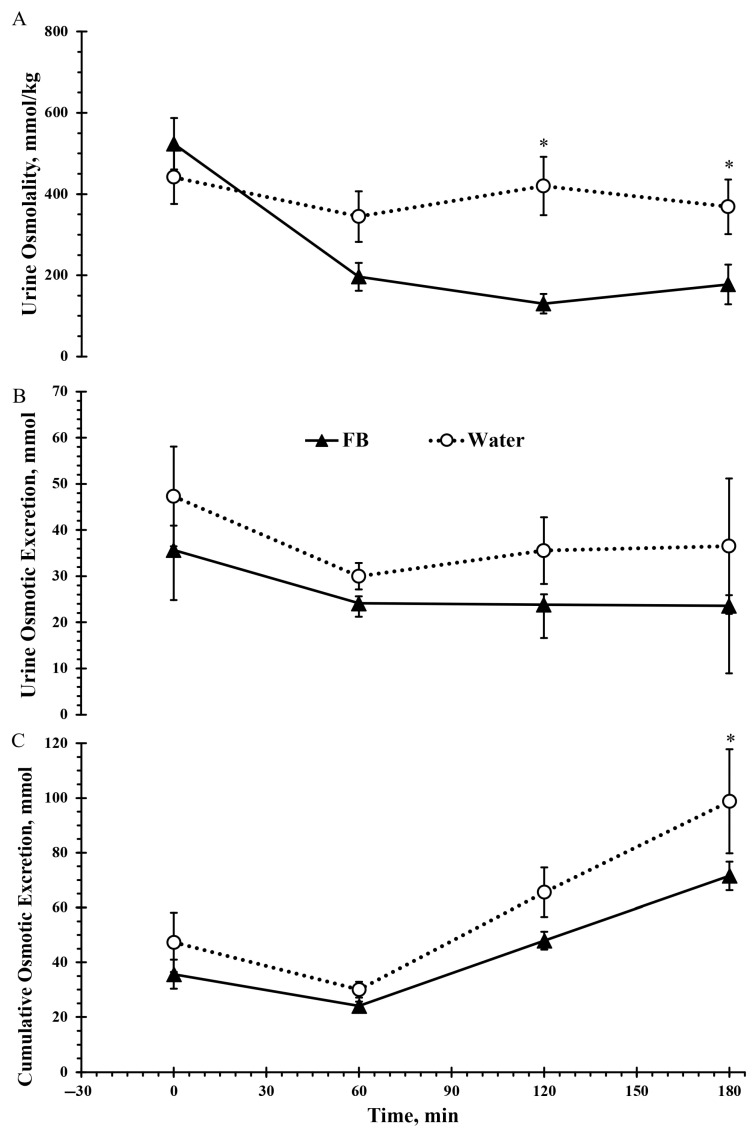
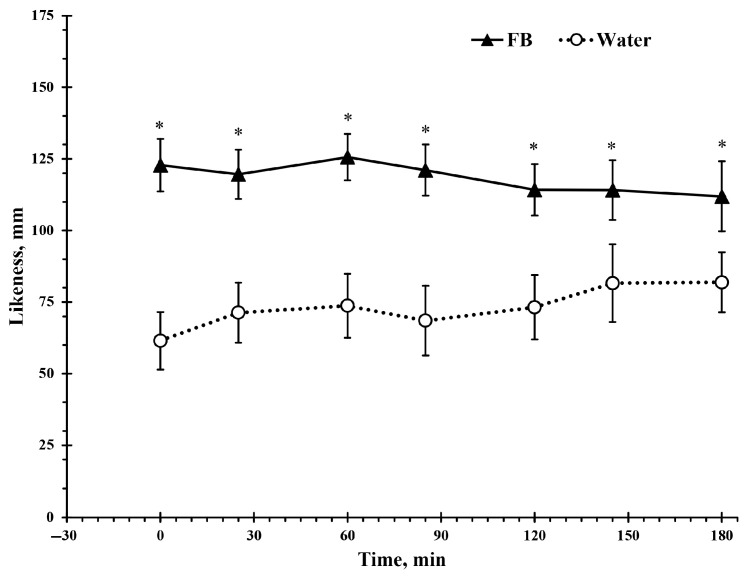
Objectives: This study examined the impact of a low-sugar flavored beverage on total fluid intake and hydration biomarkers during intermittent exercise in a hot environment among healthy children. Methods: Twenty-one children (11 girls, 8-10 y) completed a randomized, crossover study with two trials. Each trial involved three bouts of 10 min walking, 5 min rest, 10 min walking, and 35 min rest for a total of 3 h in a hot (29.9 ± 0.6 °C) and dry environment (26 ± 7% relative humidity). Walking intensity was 69 ± 7% of age-predicted maximum heart rate. Participants consumed either plain water (W) or a low-sugar flavored beverage (FB). Body weight, fluid intake, urine samples, and perceptual ratings were collected. Results: Total ad libitum fluid intake was significantly higher with the FB (946 ± 535 mL) than with W (531 ± 267 mL; p < 0.05). This difference was 128% higher for FB compared to W, with 19 out of the 21 children ingesting more fluids in FB versus W. Children rated the FB as more likable across all time points (p < 0.05). Net fluid balance was better with FB at 60, 70, 85, 135, and 145 min (p < 0.05), though not different at the 3 h mark. Urine volume was higher with FB (727 ± 291 mL) than with W (400 ± 293 mL; p < 0.05). Urine osmolality was significantly higher in the W trial at 120 and 180 min (p < 0.05). Conclusions: A flavored, low-sugar beverage enhanced ad libitum fluid intake and improved hydration markers compared to water during exercise in the heat, supporting its potential as a practical rehydration strategy for children.
Keywords: body fluid balance; dehydration; drinking; palatability; sweating.
Conflict of interest statement
F.C.W. has received grants during the last 36 months from external partners that were not related to this project, including FEMA, Arizona Board of Regents, Pac-12 Health and Wellbeing Initiative, CSPDA, Standard Process Inc., The Kraft Heinz Company, Unilever Corporation, and Friesland Campina. J.C.S. has an active research grant from Unilever. C.X.M. served as a scientific consultant for The Kraft Heinz Company between 2021 and 2023, and since 2019, has received research funding from The Kraft Heinz Company, Niagara Cares, and the Drinking Water Research Foundation. S.A.K., during the last 36 months, has had active research grants from the National Science Foundation, USDA, The Kraft Heinz Company, Unilever, and Standard Process. During this time, he was a lead research aerospace physiologist at Luke Air Force Base and served as a member of the science advisory board for Hyduro Inc, Zico Rising, Trace Minerals, and Rockley Photonics. He has also provided scientific consultation to the American Beverage Association, Unilever, Pepsico, The Coca-Cola Company, and The Kraft Heinz Company. He is also the owner of Dr Hydration LLC.
Figures
Similar articles
-
Study on the Differences in the Thirst-Quenching Effects of Different Beverages Supplemented Before Exercise: A Randomized Crossover Trial.Nutrients. 2025 Feb 21;17(5):760. doi: 10.3390/nu17050760. Nutrients. 2025. PMID: 40077631 Free PMC article. Clinical Trial.
-
Intravenous fluids for reducing the duration of labour in low risk nulliparous women.Cochrane Database Syst Rev. 2013 Jun 18;2013(6):CD007715. doi: 10.1002/14651858.CD007715.pub2. Cochrane Database Syst Rev. 2013. PMID: 23780639 Free PMC article.
-
Ad libitum fluid intake and plasma responses after pickle juice, hypertonic saline, or deionized water ingestion.J Athl Train. 2013 Nov-Dec;48(6):734-40. doi: 10.4085/1062-6050-48.5.04. Epub 2013 Aug 16. J Athl Train. 2013. PMID: 23952039 Free PMC article.
-
Clinical symptoms, signs and tests for identification of impending and current water-loss dehydration in older people.Cochrane Database Syst Rev. 2015 Apr 30;2015(4):CD009647. doi: 10.1002/14651858.CD009647.pub2. Cochrane Database Syst Rev. 2015. PMID: 25924806 Free PMC article.
-
Influence of beverage temperature on palatability and fluid ingestion during endurance exercise: a systematic review.Int J Sport Nutr Exerc Metab. 2012 Jun;22(3):199-211. doi: 10.1123/ijsnem.22.3.199. Int J Sport Nutr Exerc Metab. 2012. PMID: 22693241
References
-
- Kenney E.L., Long M.W., Cradock A.L., Gortmaker S.L. Prevalence of Inadequate Hydration Among US Children and Disparities by Gender and Race/Ethnicity: National Health and Nutrition Examination Survey, 2009–2012. Am. J. Public Health. 2015;105:e113–e118. doi: 10.2105/AJPH.2015.302572. - DOI - PMC - PubMed
Publication types
MeSH terms
Substances
Grants and funding
LinkOut - more resources
Full Text Sources
Medical
