. 2025 Jul 23;26(15):7121.
doi: 10.3390/ijms26157121.

Unnatural Amino Acid Photo-Crosslinking Sheds Light on Gating of the Mechanosensitive Ion Channel OSCA1.2

Affiliations

Unnatural Amino Acid Photo-Crosslinking Sheds Light on Gating of the Mechanosensitive Ion Channel OSCA1.2

Scarleth Duran-Morales et al. Int J Mol Sci. .

Abstract

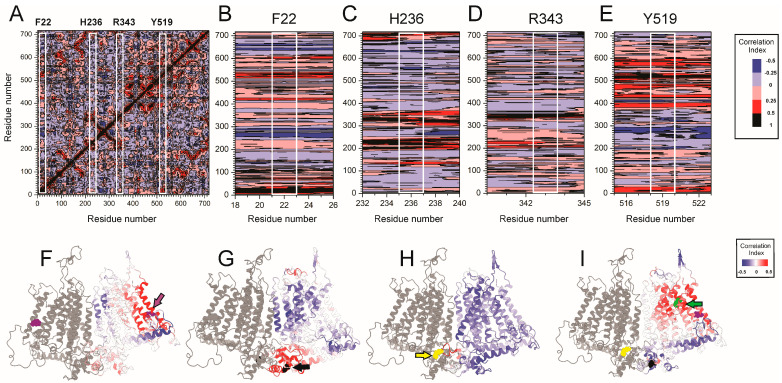
Mechanosensitive ion channels such as OSCA1.2 enable cells to sense and respond to mechanical forces by translating membrane tension into ionic flux. While lipid rearrangement in the inter-subunit cleft has been proposed as a key activation mechanism, the contributions of other domains to OSCA gating remain unresolved. Here, we combined the genetic encoding of the photoactivatable crosslinker p-benzoyl-L-phenylalanine (BzF) with functional Ca2+ imaging and molecular dynamics simulations to dissect the roles of specific residues in OSCA1.2 gating. Targeted UV-induced crosslinking at positions F22, H236, and R343 locked the channel in a non-conducting state, indicating their functional relevance. Structural analysis revealed that these residues are strategically positioned: F22 interacts with lipids near the activation gate, H236 lines the lipid-filled cavity, and R343 forms cross-subunit contacts. Together, these results support a model in which mechanical gating involves a distributed network of residues across multiple channel regions, allosterically converging on the activation gate. This study expands our understanding of mechanotransduction by revealing how distant structural elements contribute to force sensing in OSCA channels.

Keywords: OSCA1.2; ion channel gating; mechanosensing; unnatural amino acids (UAAs).


Conflict of interest statement

The authors declare no conflicts of interest.

Figures

Figure 1
Figure 1
Structural organization of OSCA1.2 channel and location of BzF-substituted residues. (A) Ribbon diagram of the transmembrane protein complex showing one monomer highlighted in color and the remaining subunit in gray. Individual transmembrane helices (TMs) are colored distinctly to illustrate their arrangement within the membrane according to the labels in (B). Intracellular domain is shown in light green. (B) Schematic topology model of a single monomer, displaying the arrangement of transmembrane helices (TM0–TM10), N-terminal domain (NTD), and C-terminal domain (CTD). Intracellular helices (ILH1–ILH4) and intracellular loops (IL1–IL4) are shown below the membrane-spanning region. (C) OSCA1.2 channel in a dimeric assemble highlighting residues substituted with BzF for crosslinking assays (see Figure 2). Residues F22, H236, F324, R343, W361, and F389 (green subunit) are shown in van der Waals representation. (D) Schematic of the genetic code expansion strategy used for site-specific incorporation of BzF into OSCA1.2. The amber stop codon (TAG) is introduced at selected sites in the OSCA1.2 gene. Co-expression of an orthogonal tRNA/synthetase pair enables BzF incorporation during translation, allowing UV-induced crosslinking of proximal residues in the protein.
Figure 2
Figure 2
UV-induced photo-crosslinking at specific residues disrupts OSCA1.2 channel opening. Representative pseudocoloring of HEK293T Piezo1−/− cells expressing (A) OSCA1.2-wild-type and (B) OSCA1.2-F22BzF in control (upper panels) and UV-treated conditions (lower panels). Images show three time points: baseline (C), after the first hyperosmotic stimulus (P1), and after the second stimulus (P2), which followed a 30–40 s UV pulse. White arrows indicate representative cells used for quantification. Scale bars: 10 μm. Line plots display fluorescence responses over time; black and purple bars above indicate timing of hyperosmotic pulses and UV exposure, respectively. (C) Quantification of calcium response ratios (P2/P1) for five OSCA1.2 constructs under control (gray) and UV-treated (purple) conditions. Each dot represents one n (average of 10 cells), and sample sizes are shown below each group. UV exposure significantly reduced P2/P1 ratios in F22BzF, H236BzF, and R343BzF mutants, but not in wild-type or F389BzF channels. Data represent mean ± SEM. Unpaired two-tailed t-tests were used for statistical comparisons. ** p < 0.01; *** p < 0.001; ns, not significant.
Figure 3
Figure 3
Lipid proximity and membrane exposure of key residues F22 and H236 in OSCA1.2. (A) Structural model of the transmembrane protein complex shown in cartoon representation with a semi-transparent surface overlay for the lipid bilayer. Individual subunits are colored green and salmon. Residues F22 (blue), H236 (red), and R343 (yellow), whose crosslinking impaired channel function when substituted with BzF (Figure 2), are shown in van der Waals representations and highlighted with black arrows. (B) Lipid interaction occupancy profile for each residue over the course of the molecular simulation, with a cutoff distance for a positive interaction of 5Å. (C) Average distance (in Å) from each residue to any lipid molecule throughout the simulation. Residues F22, H236, and R343 are enclosed by blue, red, and yellow boxes, respectively.
Figure 4
Figure 4
Intra- and inter-subunit contacts analysis reveals structural coupling between N-terminal helix, activation gate, and dimer interface in OSCA1.2. (A) Intra-subunit distance matrix for a single OSCA1.2 protomer, highlighting close-contact residue pairs. F22, H236, and R343 are indicated with dashed boxes. Contact distances are color-coded from 2 Å (blue) to 20 Å (green). (B,C) Structural models showing OSCA1.2 as a homodimer (salmon and green), with contact residues F22 and H236 highlighted. R343 was omitted for not showing significant intra-subunit contacts (see main text) (D) Close-up of F22 forming a hydrophobic cluster with I532, V604, and L600 near TM6, suggesting a stabilizing role near the proposed activation gate (Y519 lies nearby). (E) H236 lies adjacent to S218 on TM3, suggesting a stabilizing interaction potentially involved in gating. (F) Inter-subunit distance map showing residue contacts between opposing protomers. Interfacial contacts for F22, H236, and R343 are indicated with dashed boxes. (G) Structural models showing OSCA1.2 as a homodimer (salmon and green), with contact residue R343 highlighted. F22 and H236 were omitted for not showing significant inter-subunit contact (see main text). (H) Close-up of the inter-subunit interaction cluster centered on R343 (chain A), L189, and E687 (chain B).
Figure 5
Figure 5
Dynamic cross-correlation analysis reveals distinct allosteric interaction networks involving F22, H236, R343, and Y519 in OSCA1.2. (A) Global dynamic cross-correlation matrix (DCCM) from 1 μs molecular dynamics simulations of OSCA1.2. Axes represent residue indices. Color scale indicates the magnitude and direction of correlated motions. White boxes mark the positions of F22, H236, R343, and Y519. Residue-specific cross-correlation profiles centered on F22 (B), H236 (C), R343 (D), and Y519 (E). Each row shows the correlation of the focal residue (white lines) with all others. (FI) Structural representations of OSCA1.2 dimers highlighting residues and regions dynamically correlated with the focal residues. One protomer is shown in gray; the other is colored by correlation intensity (blue = anticorrelated, red = positively correlated). Key residues are pointed by arrows and shown in van der Waals representation: F22 (purple), H236 (black), R343 (yellow), and Y519 (green). Color scales apply to panels (FI), ranging from –0.5 (anticorrelated, blue) to >0.5 (correlated, red).

Similar articles

References

    1. Arnadóttir J., Chalfie M. Eukaryotic mechanosensitive channels. Annu. Rev. Biophys. 2010;39:111–137. doi: 10.1146/annurev.biophys.37.032807.125836. - DOI - PubMed
    1. Kefauver J.M., Ward A.B., Patapoutian A. Discoveries in structure and physiology of mechanically activated ion channels. Nature. 2020;587:567–576. doi: 10.1038/s41586-020-2933-1. - DOI - PMC - PubMed
    1. Hou C., Tian W., Kleist T., He K., Garcia V., Bai F., Hao Y., Luan S., Li L. DUF221 proteins are a family of osmosensitive calcium-permeable cation channels conserved across eukaryotes. Cell Res. 2014;24:632–635. doi: 10.1038/cr.2014.14. - DOI - PMC - PubMed
    1. Yuan F., Yang H., Xue Y., Kong D., Ye R., Li C., Zhang J., Theprungsirikul L., Shrift T., Krichilsky B., et al. OSCA1 mediates osmotic-stress-evoked Ca2+ increases vital for osmosensing in Arabidopsis. Nature. 2014;514:367–371. doi: 10.1038/nature13593. - DOI - PubMed
    1. Wu X., Yuan F., Wang X., Zhu S., Pei Z.M. Evolution of osmosensing OSCA1 Ca2+ channel family coincident with plant transition from water to land. Plant Genome. 2022;15:e20198. doi: 10.1002/tpg2.20198. - DOI - PubMed

LinkOut - more resources