. 2025 Jul 25;26(15):7179.
doi: 10.3390/ijms26157179.

Lupeol Attenuates Oxysterol-Induced Dendritic Cell Activation Through NRF2-Mediated Antioxidant and Anti-Inflammatory Effects

Affiliations

Lupeol Attenuates Oxysterol-Induced Dendritic Cell Activation Through NRF2-Mediated Antioxidant and Anti-Inflammatory Effects

Sarmistha Saha et al. Int J Mol Sci. .

Abstract

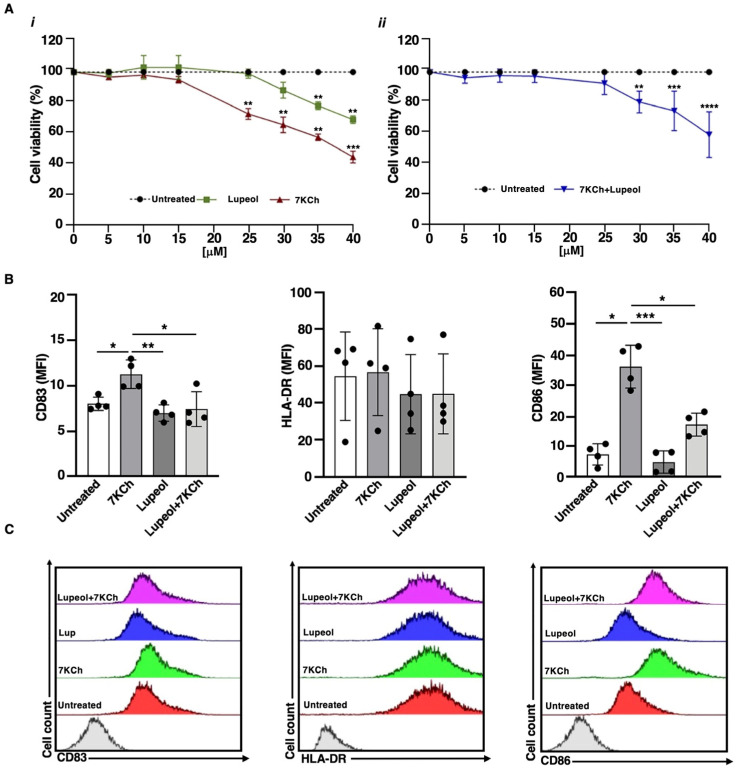
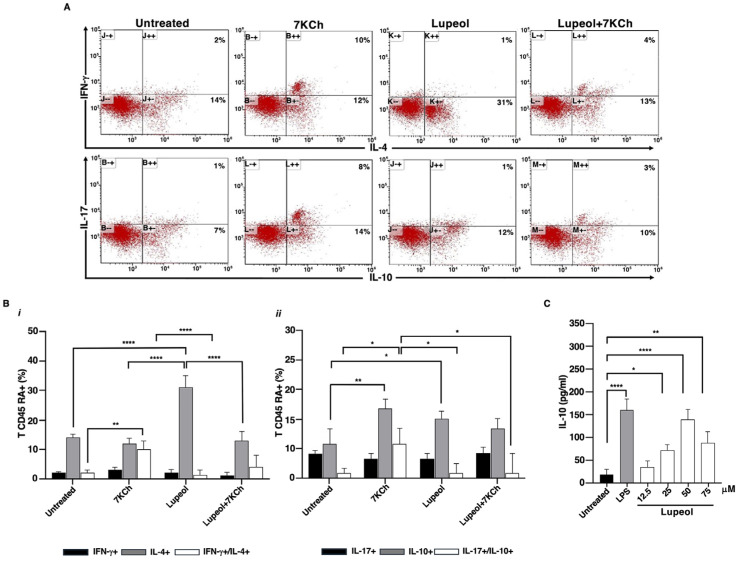
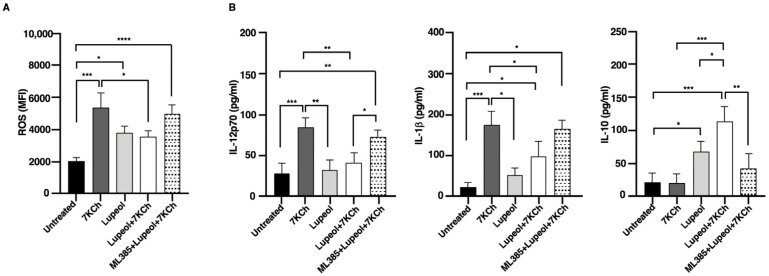
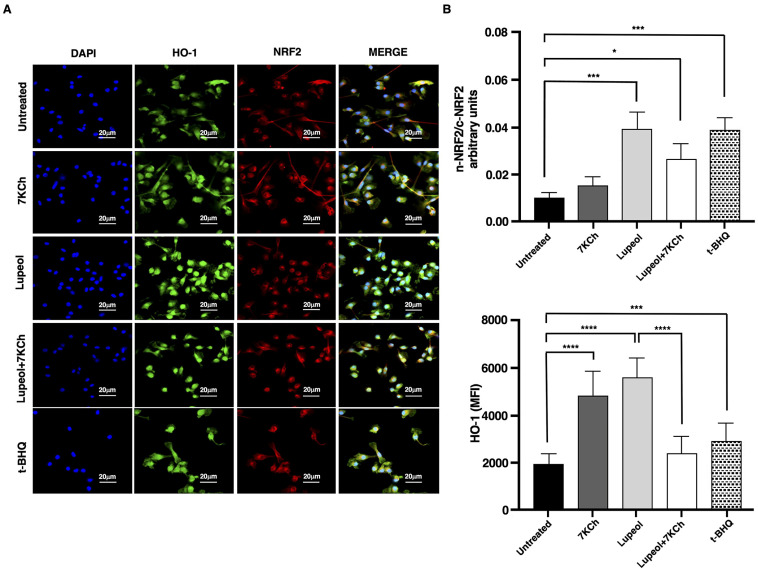
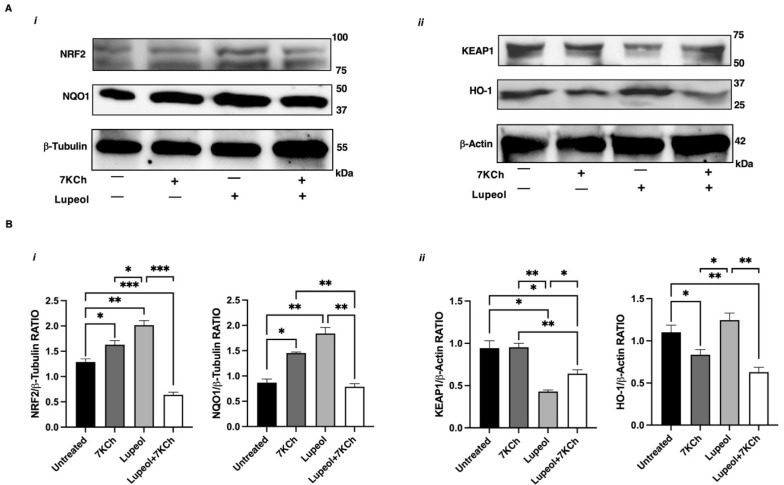
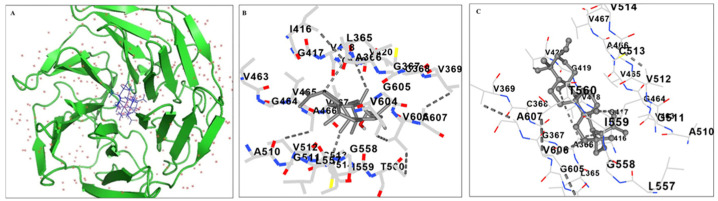
Oxysterols such as 7-ketocholesterol (7KCh) contribute to the pathogenesis of autoimmune and chronic inflammatory diseases by inducing oxidative stress and promoting pro-inflammatory immune cell activation. Dendritic cells (DCs) play a central role in maintaining immune tolerance, and their dysregulation is a key driver of autoimmunity. Targeting DCs by using natural compounds offers a promising strategy to restore redox balance and suppress aberrant immune responses. This study investigated the immunomodulatory and antioxidant properties of Lupeol, a natural triterpenoid, in human monocyte-derived DCs exposed to 7KCh. Flow cytometry and cytokine profiling demonstrated that Lupeol preserved the immature, tolerogenic phenotype of DCs by promoting a dose-dependent increase in the anti-inflammatory cytokine IL-10. Lupeol also inhibited the 7KCh-induced upregulation of maturation markers (CD83, CD86) and suppressed the release of pro-inflammatory cytokines IL-1β and IL-12p70. Functionally, Lupeol-treated DCs directed T cell polarization toward an anti-inflammatory and regulatory profile while dampening the inflammatory responses triggered by 7KCh. This immunoregulatory effect was further supported by the decreased secretion of the pro-inflammatory cytokines IL-1β and IL-12p70 in DC culture supernatants. Mechanistic analyses using immunofluorescence showed that Lupeol alone significantly increased nuclear NRF2 levels and upregulated HO-1 expression. Western blot analysis further confirmed Lupeol's ability to activate the KEAP1-NRF2 signaling pathway, as evidenced by increased expression of NRF2 and its downstream target, NQO1. The use of ML385, a selective NRF2 inhibitor, in ROS and cytokine assays supported the involvement of NRF2 in mediating the Lupeol antioxidant and anti-inflammatory effects in DCs. Notably, the oxidative burden induced by 7KCh limited the full activation of NRF2 signaling triggered by Lupeol. Furthermore, docking and MM/PBSA analyses revealed the specific interactions of Lupeol with the kelch domain of KEAP1. These findings suggest that Lupeol may serve as a promising orally available immunomodulatory agent capable of promoting tolerogenic DCs, offering potential applications in autoimmune and other chronic inflammatory diseases.

Keywords: autoimmune diseases; dendritic cells; natural compound.


Conflict of interest statement

The authors declare no conflicts of interest.

Figures

Figure 1
Figure 1
(A) Viability of immature monocyte-derived dendritic cells (iDCs) after in vitro exposure to Lupeol and 7-ketocholesterol (7KCh). The percentage of viable cells was assessed by trypan blue exclusion after 18 h of exposure to (i) Lupeol or 7KCh (0–40 μM) or (ii) their combination [7KCh (15 μM) + Lupeol (0–40 μM)]. Data represent the mean ± SD of three independent experiments. Dotted lines represent untreated cells (100% viable cells). Statistical significance was determined by unpaired t-test: ** p < 0.01; *** p < 0.001; **** p < 0.0001 vs. control. (B) Surface marker expression on immature monocyte-derived dendritic cells (iDCs) after in vitro exposure to Lupeol and 7KCh. Immature DCs (8 × 10⁵ cells/mL) were stimulated with or without Lupeol (25 µM) and 7KCh (15 µM) or both for 18 h, and then a four-color flow cytometry analysis was performed to evaluate surface marker expression. Histograms show the mean fluorescence intensity (MFI) of CD83, HLA-DR, and CD86 expression. (C) Representative two-dimensional flow cytometry plot images showing the fluorescence intensity of surface markers under different conditions. Results are expressed as mean value ± SD of four independent experiments. Significance was determined by one-way ANOVA followed by Tukey’s post hoc analysis; * p < 0.05; ** p < 0.01; *** p < 0.001.
Figure 2
Figure 2
Lupeol-treated DCs stimulated allogeneic naive human T cells to produce IL-4 and IL-10. (A). Five-day human DCs were stimulated with or without Lupeol (25 µM) and 7KCh (15 µM) for 18 h. Negatively selected naïve allogeneic T cells were co-cultured with the treated DCs at a 20:1 ratio for 10 days and then the cells were stained with anti-hu-CD3PerCP and processed for intracellular labeling with anti-hu-IFN-γ-APC and anti-hu-IL-4-PE or anti-hu-IL-17-APC anti-hu-IL-10-PE. The numbers into the dotplots show the percentage of activated CD3+ cells producing the cytokine. The figure shows a representative experiment from 3 with similar results. (B) Histograms show the percentage of activated allogeneic CD3+ CD45RA+ T cells producing the IFN-γ and IL-4 cytokines (i) and the IL-17 and IL-10 cytokines (ii) analyzed by flow cytometry. (C) Dose-response production of IL-10 in Lupeol-stimulated DC culture supernatants after 18 h was analyzed by specific ELISA experiments. Results are expressed as mean value ± SD of 3 independent experiments. Significance was determined by one-way ANOVA followed by Tukey’s post hoc analysis; * p < 0.05; ** p < 0.01; **** p < 0.0001.
Figure 3
Figure 3
Flow cytometry analysis of intracellular ROS and cytokine production in immature monocyte-derived dendritic cells (iDCs). (A) The histogram shows media and standard deviations of the mean fluorescence intensity (MFI) of ROS production after 18 h analyzed by flow cytometry in treated or untreated iDC. (B) Cytokine production in supernatants collected after 18 h was analyzed by specific ELISA experiments in treated or untreated iDC. Significance was determined by one-way ANOVA followed by Tukey’s post hoc analysis; * p < 0.05; ** p < 0.01; *** p < 0.001; **** p < 0.0001.
Figure 4
Figure 4
Analysis of NRF-2 pathway in immature monocyte-derived dendritic cells (iDCs) treated with Lupeol. (A) Representative immunofluorescent staining of NRF2 and HO-1 in iDCs treated with Lupeol (25 µM), 7KCh (15 µM) or tertbutylhydroquinone (t-BHQ) for 18 h. The upright microscope Nikon Eclipse Ni-U with 60× magnification was used to capture micrographs. (B) Quantification of the intensity of the fluorescence signal for HO-1 and NRF2 by using Image J 1.53 t software. Nuclei were counterstained with DAPI, and nuclear segmentation was performed for each field of view using the DAPI fluorescence signal. Whole-cell fluorescence intensities of HO-1 and NRF2 were quantified by analyzing their respective signals in the green and red channels. To assess NRF2 translocation dynamics, nuclear and cytosolic NRF2 signals were delineated based on their corresponding fluorescence in the previously segmented compartments. The translocation of NRF2 was determined by calculating the ratio of mean pixel intensity between the nuclear (n) and cytoplasmic (c) compartments (n-NRF2/c-NRF2 ratio). Data are presented as the mean ± SD for each group (n = 3). Significance was determined by one-way ANOVA followed by Tukey’s post hoc analysis; * p < 0.05; *** p < 0.001; **** p < 0.0001.
Figure 5
Figure 5
Analysis of NRF-2 pathway in immature monocyte-derived dendritic cells (iDCs) treated with Lupeol. (A) Representative Western blot results for NRF2 and NQO1 (i), and for KEAP1 and HO-1 (ii) in the whole-cell lysates of iDCs treated with 7KCh or Lupeol or both for 18 h. (B) Densitometric analysis of NRF2 and NQO1 panel (i) and KEAP1 and HO-1 panel (ii) in iDCs. Analyses were performed with National Institutes of Health ImageJ 1.62 software and normalized to the appropriate housekeeping proteins β-tubulin or β-actin. Normalized band intensities are expressed as the ratio of target protein to housekeeping control as mean ± SD of 3 independent experiments. Significance was determined by one-way ANOVA followed by Tukey’s post hoc analysis; * p < 0.05; ** p < 0.01; *** p < 0.001.
Figure 6
Figure 6
Molecular docking analysis. Docking and MM/PBSA analyses evaluating the specific interactions of lupeol with kelch domain of Keap1. (A) Ribbon representation of the KEAP1 protein (green) bound to the ligand Lupeol (gray sticks); surrounding red dots indicate water molecules, (B) Snapshot of the 3D- binding mode of the ligand with the protein and (C) Snapshot of the anchoring residues of kelch domain forming H-bonds with the ligand. Atoms are colored by element: oxygen (red), nitrogen (blue), and sulfur (yellow); dashed lines represent hydrogen bonds.

Similar articles

References

    1. Hayter S.M., Cook M.C. Updated Assessment of the Prevalence, Spectrum and Case Definition of Autoimmune Disease. Autoimmun. Rev. 2012;11:754–765. doi: 10.1016/j.autrev.2012.02.001. - DOI - PubMed
    1. Duc D., Vigne S., Pot C. Oxysterols in Autoimmunity. Int. J. Mol. Sci. 2019;20:4522. doi: 10.3390/ijms20184522. - DOI - PMC - PubMed
    1. Hayden J.M., Brachova L., Higgins K., Obermiller L., Sevanian A., Khandrika S., Reaven P.D. Induction of Monocyte Differentiation and Foam Cell Formation in Vitro by 7-Ketocholesterol. J. Lipid Res. 2002;43:26–35. doi: 10.1016/S0022-2275(20)30183-8. - DOI - PubMed
    1. Perrin-Cocon L., Coutant F., Agaugué S., Deforges S., André P., Lotteau V. Oxidized Low-Density Lipoprotein Promotes Mature Dendritic Cell Transition from Differentiating Monocyte. J. Immunol. 2001;167:3785–3791. doi: 10.4049/jimmunol.167.7.3785. - DOI - PubMed
    1. Ates I., Yılmaz A.D., Buttari B., Arese M., Saso L., Suzen S. A Review of the Potential of Nuclear Factor [Erythroid-Derived 2]-like 2 Activation in Autoimmune Diseases. Brain Sci. 2023;13:1532. doi: 10.3390/brainsci13111532. - DOI - PMC - PubMed

LinkOut - more resources