. 2025 Jul 25;26(15):7187.
doi: 10.3390/ijms26157187.

Single-Cell Dissection of the Serrated Pathway: Cellular Heterogeneity and Genetic Causality in Colorectal Cancer

Affiliations

Single-Cell Dissection of the Serrated Pathway: Cellular Heterogeneity and Genetic Causality in Colorectal Cancer

Ming Cen et al. Int J Mol Sci. .

Abstract

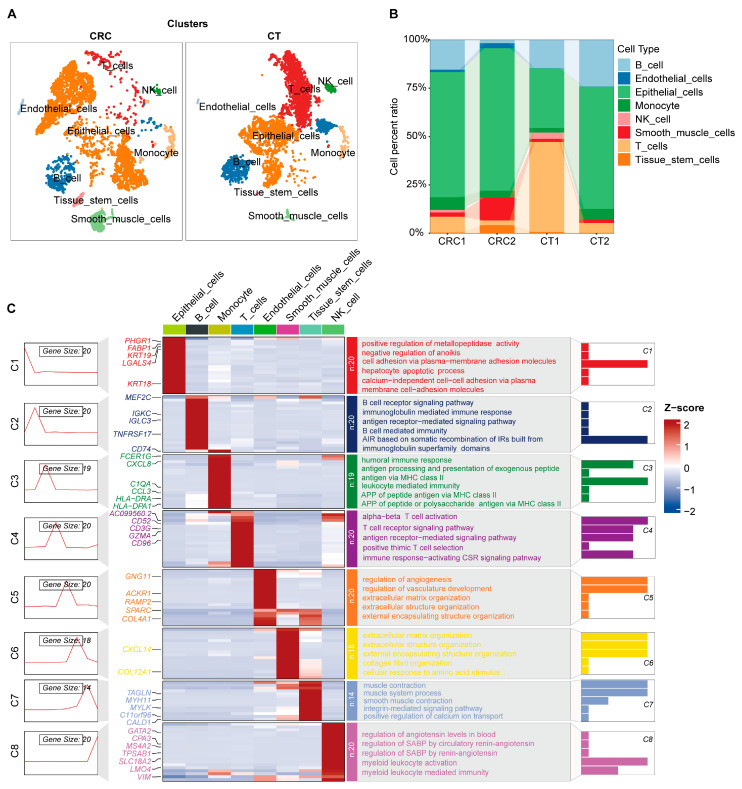
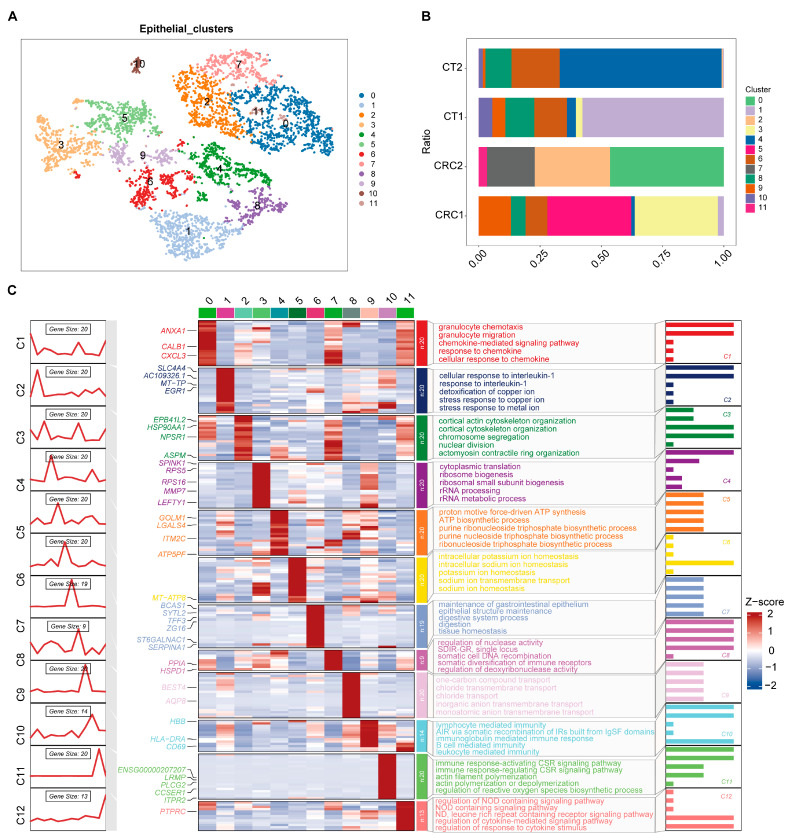
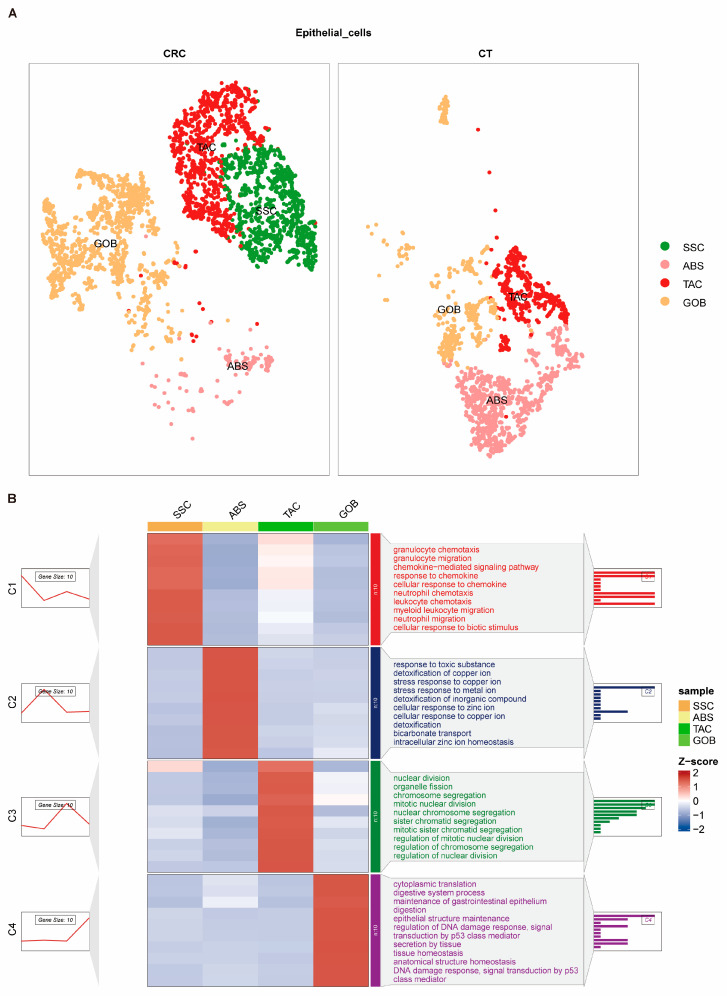
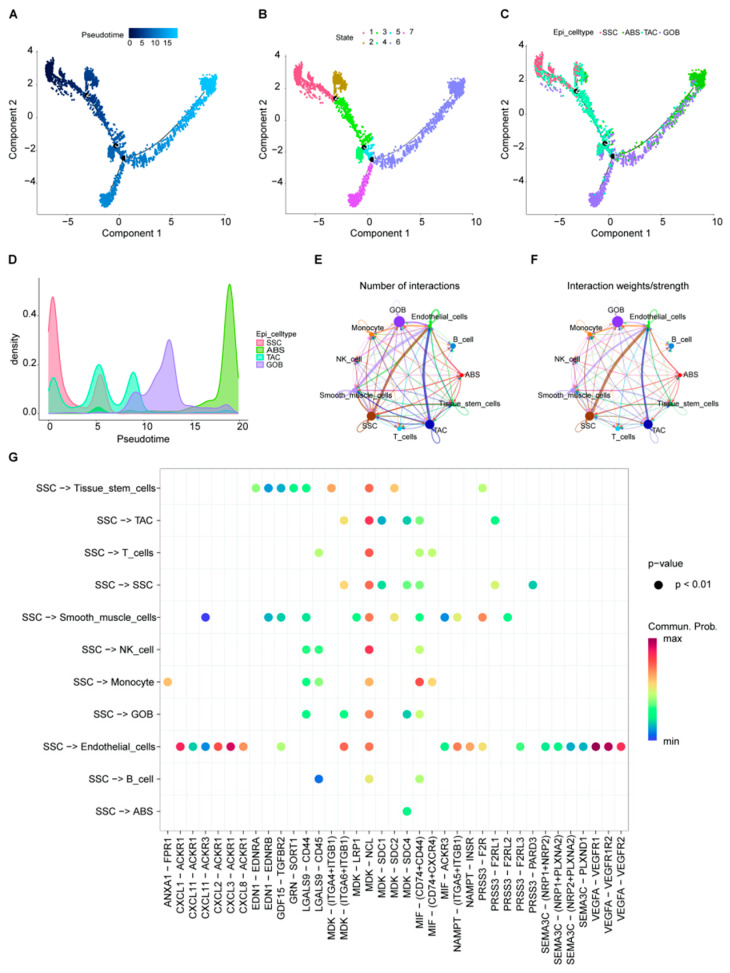
The serrated pathway represents a significant route to colorectal cancer (CRC), accounting for approximately 15-30% of cases, yet the specific epithelial cell subpopulations driving this pathway remain poorly understood. This study explores the causal relationship between serrated epithelial cells and CRC risk using single-cell transcriptomics and Mendelian randomization (MR). Publicly available single-cell RNA sequencing data were utilized to analyze epithelial cell subpopulations in CRC, focusing on specific serrated cells (SSCs). By integrating genome-wide association study data, MR was employed to assess the causal relationship between gene expression patterns and CRC risk. The study found that an increase in SSCs is closely associated with CRC progression. MR analysis revealed a significant correlation between expression changes in specific genes, such as IER3 in SSCs, and CRC risk (p < 0.05). Functional analyses indicated that IER3 may promote malignancy by regulating cell proliferation, adhesion, and immune evasion. Several genetic loci related to SSC gene expression were identified and validated for CRC risk association. This study demonstrates the significant role of serrated epithelial cell subpopulations in CRC development, particularly through key genes such as IER3, providing new perspectives for understanding CRC pathogenesis and future therapeutic strategies.

Keywords: Mendelian randomization; colorectal cancer; serrated epithelial cell; single-cell transcriptomics; tumor progression.


Conflict of interest statement

The authors declare that the research was conducted in the absence of any commercial or financial relationships that could be construed as a potential conflicts of interest.

Figures

Figure 1
Figure 1
Single cell atlas (A) and cell proportion (B) of colorectal cancer (CRC), representative marker gene expression, and biological functions of different cell groups (C). CRC, colorectal cancer; CT, healthy control group. AIR, adaptive immune response; IRs, immune receptors; APP, antigen processing and presentation; CSR, cell surface receptor; SABP, systemic arterial blood pressure.
Figure 2
Figure 2
Cell clusters atlas (A) and cell proportion (B) of epithelial cells from the single-cell RNA sequence data of colorectal cancer (CRC), representative marker gene expression, and biological functions of different cell clusters (C). CRC, colorectal cancer; CT, healthy control group; NOD, nucleotide-binding oligomerization domain; ND, nucleotide-binding domain; IgSF, immunoglobulin superfamily; AIR, adaptive immune response; IRs, immune receptors; CSR, cell surface receptor.
Figure 3
Figure 3
The atlas (A) of four subtypes of epithelial cells for colorectal cancer (CRC) and representative marker gene expression and biological functions of different epithelial cells (B). CRC, colorectal cancer; CT, healthy control group; SSC, specific serrated cells; ABS, absorptive cells; TAC, transit amplifying cells; GOB, goblet cells.
Figure 4
Figure 4
Trajectory analysis of four subgroups of epithelial cells and their interaction with other cells from colorectal cancer (CRC). (A), pseudotime analysis of epithelial cell development, with dark blue representing the early stage and light blue representing the late stage. (B), classify the developmental status of epithelial cells based on trajectory analysis of developmental nodes. (C), the distribution of four different subgroups of epithelial cells along the developmental trajectory. (D), the distribution of cell density along the developmental trajectory of four different subgroups of epithelial cells. (E), comparison of the number of interactions between four different subgroups of epithelial cells and other cells in colorectal cancer. (F), comparison of the intensity of interaction between four different subgroups of epithelial cells and other cells in colorectal cancer. (G), the distribution characteristics of ligand-receptor interactions between the SSC epithelial cell subgroup and all cells. SSC, specific serrated cells; ABS, absorptive cells; TAC, transit amplifying cells; GOB, goblet cells.
Figure 5
Figure 5
Differential gene analysis and enrichment analysis of specific serrated cells (SSCs). (A), the results of differential gene analysis between SSC cells and all colorectal cancer (CRC) cells, as well as differential analysis with non-SSC epithelial cells. (B), a protein interaction network consisting of 246 differentially expressed genes. (C), enrichment analysis of biological processes (BP) of differentially expressed genes. (D), enrichment analysis of molecular functions (MF) of differentially expressed genes. (E), enrichment analysis of molecular components (CC) of differentially expressed genes. (F), enrichment analysis of KEGG signaling pathways of differentially expressed genes.
Figure 6
Figure 6
Mendelian randomization (MR) analysis was used to screen the causal relationship between the expression quantitative trait loci (eQTL) of differentially expressed genes and colorectal cancer (CRC), as well as to analyze the expression levels and functional enrichment of candidate genes. (A), the volcano plot shows the results of MR analysis between the differential gene eQTL related to specific serrated cells (SSCs) and CRC, where red and blue represent genes with significant MR analysis, and gray represents genes without significant MR analysis. (B) The bubble plot displays the expression levels of significant genes analyzed by MR in different cell groups of CRC single-cell data. (C). Functional enrichment analysis of significant genes in MR analysis.
Figure 7
Figure 7
Switchgenes analysis for differential genes and cell chat analysis between specific serrated cells (SSCs) and other cells based on high and low expression of switch genes. (A), analysis of switch gene categories based on pseudotime from trajectory analysis. (B), cell chat number between SSCs with high and low expression of IER3 and other colorectal cancer (CRC) cells. (C), the distribution characteristics of ligand-receptor interactions between SSCs with high and low expression of IER3 and other CRC cells. TF, transcription factor; SSC, specific serrated cells; ABS, absorptive cells; TAC, transit amplifying cells; GOB, goblet cells.
Figure 8
Figure 8
Differential analysis (A) and representative GSEA results (BE) of specific serrated cells (SSCs) between high and low expression groups of IER3, as well as the regulation of metabolic pathways (F) by IER3 high and low expression. ENS, enrichment score; SSC, specific serrated cells; ABS, absorptive cells; TAC, transit amplifing cells; GOB, goblet cells.

Similar articles

References

    1. Bray F., Laversanne M., Sung H., Ferlay J., Siegel R.L., Soerjomataram I., Jemal A. Global cancer statistics 2022: GLOBOCAN estimates of incidence and mortality worldwide for 36 cancers in 185 countries. CA A Cancer J. Clin. 2024;74:229–263. doi: 10.3322/caac.21834. - DOI - PubMed
    1. Han B., Zheng R., Zeng H., Wang S., Sun K., Chen R., Li L., Wei W., He J. Cancer incidence and mortality in China, 2022. J. Natl. Cancer Cent. 2024;4:47–53. doi: 10.1016/j.jncc.2024.01.006. - DOI - PMC - PubMed
    1. Crockett S.D., Nagtegaal I.D. Terminology, Molecular Features, Epidemiology, and Management of Serrated Colorectal Neoplasia. Gastroenterology. 2019;157:949–966.e4. doi: 10.1053/j.gastro.2019.06.041. - DOI - PubMed
    1. Ijspeert J.E.G., Vermeulen L., Meijer G.A., Dekker E. Serrated neoplasia—Role in colorectal carcinogenesis and clinical implications. Nat. Rev. Gastroenterol. Hepatol. 2015;12:401–409. doi: 10.1038/nrgastro.2015.73. - DOI - PubMed
    1. Li D., Doherty A.R., Raju M., Liu L., Lei N.Y., Amsden L.B., Lee J.K., Levin T.R., Corley D.A., Herrinton L.J. Risk stratification for colorectal cancer in individuals with subtypes of serrated polyps. Gut. 2021;71:324301. doi: 10.1136/gutjnl-2021-324301. - DOI - PubMed

LinkOut - more resources