. 2025 Jul 27;26(15):7264.
doi: 10.3390/ijms26157264.

Physiological and Transcriptomic Analyses Reveal Regulatory Mechanisms of Adventitious Root Formation in In Vitro Culture of Cinnamomum camphora

Affiliations

Physiological and Transcriptomic Analyses Reveal Regulatory Mechanisms of Adventitious Root Formation in In Vitro Culture of Cinnamomum camphora

Yuntong Zhang et al. Int J Mol Sci. .

Abstract

Cinnamomum camphora is an ecologically and economically significant species, highly valued for its essential oil production and environmental benefits. Although a tissue culture system has been established for C. camphora, large-scale propagation remains limited due to the inconsistent formation of adventitious roots (ARs). This study investigated AR formation from callus tissue, focusing on associated physiological changes and gene expression dynamics. During AR induction, contents of soluble sugars and proteins decreased, alongside reduced activities of antioxidant enzymes, including superoxide dismutase (SOD), peroxidase (POD), and polyphenol oxidase (PPO). Levels of indole-3-acetic acid (IAA) and abscisic acid (ABA) decreased significantly throughout AR formation. Zeatin riboside (ZR) levels initially declined and then rose, whereas gibberellic acid (GA) levels displayed the opposite trend. Comparative transcriptomic and temporal expression analyses identified differentially expressed genes (DEGs), which were grouped into four distinct expression patterns. KEGG pathway enrichment indicated that 67 DEGs are involved in plant hormone signaling pathways and that 38 DEGs are involved in the starch and sucrose metabolism pathway. Additionally, protein-protein interaction network (PPI) analysis revealed ten key regulatory genes, which are mainly involved in auxin, cytokinin, GA, ABA, and ethylene signaling pathways. The reliability of the transcriptome data was further validated by quantitative real-time PCR. Overall, this study provides new insights into the physiological and molecular mechanisms underlying AR formation in C. camphora and offers valuable guidance for optimizing tissue culture systems.

Keywords: RNA-seq; endogenous hormones; morphogenesis; oxidoreductases; temporal dynamics.


Conflict of interest statement

The authors declare no conflicts of interest.

Figures

Figure 1
Figure 1
The morphological and anatomical change of the basal region of the cuttings during AR formation. (AC) Morphological observations. (D,E) Anatomical observations. (A,D) ZM1. Callus induction. (B,E) ZM2. Callus formation. (C,F) ZM3. AR emergence.
Figure 2
Figure 2
Changes in nutrient content and enzyme activity in different stages. ZM1, ZM2, and ZM3 represent callus induction, callus formation, and AR emergence stages, respectively. Note: n = 6 for each treatment group. Different lowercase letters indicate significant differences (p < 0.05).
Figure 3
Figure 3
Changes in endogenous hormone levels during AR formation. ZM1, ZM2, and ZM3 represent callus induction, callus formation, and AR emergence stages, respectively. Note: n = 6 for each treatment group. Different lowercase letters indicate significant differences (p < 0.05).
Figure 4
Figure 4
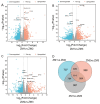
Volcano plots and Venn diagram of DEGs. In the volcano plots, each point represents a gene. (A) Volcano plot of ZM1 vs. ZM2. (B) Volcano plot of ZM1 vs. ZM3. (C) Volcano plot of ZM2 vs. ZM3. (D) Venn diagram of DEGs among the three comparisons. The x-axis shows the log2 fold change, which indicates the log2 value of the fold change in expression levels of a gene between two samples. The y-axis represents either the p-value or the false discovery rate (padj), with the y-value being the negative log10-transformed value of the p-value or padj. ZM1, ZM2, and ZM3 represent callus induction, callus formation, and AR emergence stages, respectively.
Figure 5
Figure 5
MFUZZ cluster and KEGG enrichment analysis of DEGs involving three point comparison groups. The colors represent the relative gene expression values after normalization adjustments. ZM1, ZM2, and ZM3 correspond to callus induction, callus formation, and AR emergence stages, respectively. The red and blue colors refer to up- and downregulation.
Figure 6
Figure 6
Bar charts of DEGs in GO enrichment analysis: (A) ZM1 vs. ZM2; (B) ZM1 vs. ZM3; (C) ZM2 vs. ZM3. In the figure, the horizontal axis shows the number of DEGs, and the vertical axis shows the Gene Ontology terms. ZM1, ZM2, and ZM3 correspond to callus induction, callus formation, and AR emergence stages, respectively.
Figure 7
Figure 7
Bar charts of DEGs in KEGG enrichment analysis: (A) ZM1 vs. ZM2; (B) ZM1 vs. ZM3; (C) ZM2 vs. ZM3. In the figure, the horizontal axis shows the number of DEGs, the vertical axis shows the KEGG pathways, and the bar colors represent different categories of KEGG pathways. ZM1, ZM2, and ZM3 correspond to callus induction, callus formation, and AR emergence stages, respectively.
Figure 8
Figure 8
Heatmap analysis of DEGs related to related to starch and sucrose metabolism and redox-related enzymes. (A) DEGs related to starch and sucrose metabolism. (B) DEGs encoding redox-related enzymes. Colored boxes indicate the log2 fold changes in three comparison groups: ZM1 vs. ZM2, ZM1 vs. ZM3, and ZM2 vs. ZM3. Red, blue, and white boxes represent significantly upregulated, significantly downregulated, and non-significantly changed genes, respectively. The intensity of the color reflects the magnitude of the log2 fold change. ZM1, ZM2, and ZM3 correspond to callus induction, callus formation, and AR emergence stages, respectively.
Figure 9
Figure 9
Expression analysis of DEGs in auxin, cytokinin, GA, ABA, and ET signal transduction pathways. The colored boxes represent the expression levels of DEGs; each box represents one time point. Yellow indicates high expression, and blue indicates low expression. The color gradient from blue to yellow indicates expression levels ranging from −1 to 1. ZM1, ZM2, and ZM3 correspond to callus induction, callus formation, and AR emergence stages, respectively.
Figure 10
Figure 10
Correlation between the expression of auxin, cytokinin, gibberellin, and abscisic acid signaling pathway genes and the contents of endogenous hormones (IAA, ZR, GA, and ABA). The size of each dot represents the strength of the correlation between gene expression and endogenous hormone contents; larger dots indicate stronger correlations. The color of the dots reflects the p-value, with redder colors indicating smaller p-values.
Figure 11
Figure 11
The diagram of protein network interactions. The size and color of each node represent the degree of the node, with larger and darker-colored nodes representing higher degrees of connectivity.
Figure 12
Figure 12
The qRT-PCR validation of genes selected randomly in RNA-seq results. Each cell includes the values at different time points. Pink bars show the relative expression levels by qRT-PCR. Blank lines represent the FPKM of RNA-seq. ZM1, ZM2, and ZM3 correspond to callus induction, callus formation, and AR emergence stages, respectively.

Similar articles

References

    1. Takaoka D. Sesquiterpene alcohols in camphor oil. Phytochemistry. 1976;15:425–426. doi: 10.1016/S0031-9422(00)86839-9. - DOI
    1. Chen C., Zheng Y., Liu S., Zhong Y., Wu Y., Li J., Xu L.A., Xu M. The complete chloroplast genome of Cinnamomum camphora and its comparison with related Lauraceae species. PeerJ. 2017;5:e3820. doi: 10.7717/peerj.3820. - DOI - PMC - PubMed
    1. Nirmal Babu K., Sajina A., Minoo D., John C.Z., Mini P.M., Tushar K.V., Rema J., Ravindran P.N. Micropropagation of camphor tree (Cinnamomum camphora) Plant Cell Tissue Organ Cult. 2003;74:179–183. doi: 10.1023/A:1023988110064. - DOI
    1. Zuzarte M., Salgueiro L., Canhoto J. Plant tissue culture: Industrial relevance and future directions. Adv. Biochem. Eng./Biotechnol. 2024;188:1–15. doi: 10.1007/10_2024_254. - DOI - PubMed
    1. Legué V., Rigal A., Bhalerao R.P. Adventitious root formation in tree species: Involvement of transcription factors. Physiol. Plant. 2014;151:192–198. doi: 10.1111/ppl.12197. - DOI - PubMed

MeSH terms

LinkOut - more resources