. 2025 Jul 28;26(15):7296.
doi: 10.3390/ijms26157296.

Gene Monitoring in Obesity-Induced Metabolic Dysfunction in Rats: Preclinical Data on Breast Neoplasia Initiation

Affiliations

Gene Monitoring in Obesity-Induced Metabolic Dysfunction in Rats: Preclinical Data on Breast Neoplasia Initiation

Francisco Claro Jr et al. Int J Mol Sci. .

Abstract

Obesity and metabolic dysfunction are established risk factors for luminal breast cancer, yet current preclinical models inadequately recapitulate the complex metabolic and immune interactions driving tumorigenesis. To develop and characterize an immunocompetent rat model of luminal breast cancer induced by chronic exposure to a cafeteria diet mimicking Western obesogenic nutrition, female rats were fed a cafeteria diet or standard chow from weaning. Metabolic parameters, plasma biomarkers (including leptin, insulin, IGF-1, adiponectin, and estrone), mammary gland histology, tumor incidence, and gene expression profiles were longitudinally evaluated. Gene expression was assessed by PCR arrays and qPCR. A subgroup underwent dietary reversal to assess the reversibility of molecular alterations. Cafeteria diet induced significant obesity (mean weight 426.76 g vs. 263.09 g controls, p < 0.001) and increased leptin levels without altering insulin, IGF-1, or inflammatory markers. Histological analysis showed increased ductal ectasia and benign lesions, with earlier fibroadenoma and luminal carcinoma development in diet-fed rats. Tumors exhibited luminal phenotype, low Ki67, and elevated PAI-1 expression. Gene expression alterations were time point specific and revealed early downregulation of ID1 and COX2, followed by upregulation of MMP2, THBS1, TWIST1, and PAI-1. Short-term dietary reversal normalized several gene expression changes. Overall tumor incidence was modest (~12%), reflecting early tumor-promoting microenvironmental changes rather than aggressive carcinogenesis. This immunocompetent cafeteria diet rat model recapitulates key metabolic, histological, and molecular features of obesity-associated luminal breast cancer and offers a valuable platform for studying early tumorigenic mechanisms and prevention strategies without carcinogen-induced confounders.

Keywords: breast cancer preclinical model; gene expression; immunocompetent rat model; luminal breast cancer; metabolic dysfunction; obesity; tumor microenvironment.


Conflict of interest statement

The authors declare no potential conflicts of interest. The authors confirm that neither the manuscript nor any parts of its content are currently under consideration or published in another journal.

Figures
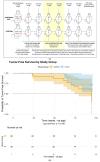
Figure 1
Figure 1
(a). Cumulative histopathological findings in the mammary glands throughout the rats’ lifespan. Rats = number of rats alive at each time point; Cancer = cumulative incidence of malignant breast tumors among rats euthanized at each time point; BT = cumulative incidence of benign breast tumors among rats euthanized at each time point. (b) Tumor-free (either benign or carcinoma) survival curves for the control and cafeteria groups. (c) Cancer-free (carcinoma) survival curves for the control and cafeteria groups. (ac) portray the timeline of events regarding tumor development throughout the approximately two-year study duration. Specifically, (a) depicts the timeline of tumor development during the study across the cafeteria and Control groups, while (b,c) depict the tumor-free and cancer-free survival probabilities for the study groups.
Figure 1
Figure 1
(a). Cumulative histopathological findings in the mammary glands throughout the rats’ lifespan. Rats = number of rats alive at each time point; Cancer = cumulative incidence of malignant breast tumors among rats euthanized at each time point; BT = cumulative incidence of benign breast tumors among rats euthanized at each time point. (b) Tumor-free (either benign or carcinoma) survival curves for the control and cafeteria groups. (c) Cancer-free (carcinoma) survival curves for the control and cafeteria groups. (ac) portray the timeline of events regarding tumor development throughout the approximately two-year study duration. Specifically, (a) depicts the timeline of tumor development during the study across the cafeteria and Control groups, while (b,c) depict the tumor-free and cancer-free survival probabilities for the study groups.
Figure 2
Figure 2
Images of a fibroadenoma in the mammary gland of a very young rat, only 25 weeks old. (A) Tumor within the mammary gland. (B) Macroscopic view of the fibroadenoma.
Figure 3
Figure 3
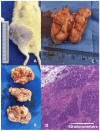
(A) Gross image of a fibroadenoma colonized by a ductal carcinoma in a middle-aged rat weighing 577.30 g, taken just before tissue harvesting. This was the largest tumor observed in the study (weighing 53 g) and the only case in which humane endpoint criteria were applied, as the tumor approached 10% of the animal’s body weight seven weeks after initial detection. Notably, this size was reached under rigorous daily monitoring, with no signs of weight loss, ulceration (as shown), pain, distress, impaired mobility, or behavioral changes, in accordance with institutional ethical guidelines. (B) Macroscopic view of the same fibroadenoma shown in panel (A). (C) Macroscopic view of a ductal carcinoma in a middle-aged rat. (D) Microscopic view of a ductal carcinoma stained with hematoxylin and eosin (H&E), 400× magnification.
Figure 4
Figure 4
(A) HER2: Positive expression in sebaceous glands (internal positive control), (400× magnification). (B) Estrogen receptor: Nuclear positivity in the tumor (400× magnification). (C) Progesterone receptor: Under dilution adjustment. Reaction with background in the epithelium, making nuclear expression evaluation not possible (200× magnification). (D) Ki67: Cellular proliferation index with nuclear marking (400× magnification). (E) PAI-1: Intense cytoplasmic expression in tumor epithelial cells (400× magnification).
Figure 5
Figure 5
Gene expression of the evaluated markers in 16-week-old rats was analyzed using Student’s t-test for the Control group (regular rodent chow, n = 30 breasts) versus the Cafeteria diet (n = 30 breasts). * = p-value < 0.05. ID1 and Cox2 showed statistically significant fold changes, with p-values of 0.021 and 0.014, respectively. The p-value for VEGFA (vascular endothelial growth factor A) was 0.06.
Figure 6
Figure 6
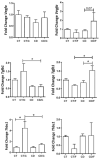
Gene expression of breast tumor markers in 25-week-old rats was compared among the following groups: a Control group of healthy rats (CT; n = 24 breasts), a group of rats fed a cafeteria diet (CD; n = 22 breasts), and a group of rats with fibroadenoma fed a cafeteria diet (CD/F; n = 2 breasts). Although the fibroadenoma group had only two samples, the standard deviation values derived from such a limited sample size are not statistically meaningful. Nevertheless, the values observed were markedly different from those of healthy breast tissue. * = p-value < 0.05.
Figure 7
Figure 7
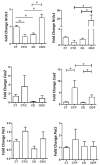
Gene expression of proliferative markers in rats aged 72 to 89 weeks, comparing the left column, a Control group with healthy rats (CT, n = 21 breasts), a diet Control group with rats that developed breast cancer (CT/C, n = 4 breasts), a group of healthy rats fed a cafeteria diet (CD, n = 27 breasts), and a group of rats with breast cancer fed a cafeteria diet (CD-C, n = 3 breasts). In the right column, a Control group with healthy rats (CT, n = 21 breasts), a diet Control group with rats that developed fibroadenoma (CT/F, n = 3 breasts), a group of healthy rats fed a cafeteria diet (CD, n = 27 breasts), and a group of rats with fibroadenoma fed a cafeteria diet (CD/F, n = 3 breasts). * = p-value < 0.05.
Figure 8
Figure 8
Gene expression of inflammatory markers in rats aged 72 to 89 weeks, comparing in the left column, a Control group with healthy rats (CT, n = 21 breasts), a diet Control group with rats that developed breast cancer (CT/C, n = 4 breasts), a group of healthy rats fed a cafeteria diet (CD, n = 27 breasts), and a group of rats with breast cancer fed a cafeteria diet (CD-C, n = 4 breasts). In the right column, a Control group with healthy rats (CT, n = 21 breasts), a diet Control group with rats that developed fibroadenoma (CT/F, n = 3 breasts), a group of healthy rats fed a cafeteria diet (CD, n = 27 breasts), and a group of rats with fibroadenoma fed a cafeteria diet (CD/F, n = 3 breasts). * = p-value < 0.05.
Figure 9
Figure 9
Gene expression of repair markers in rats aged 72 to 89 weeks, comparing a Control group with healthy rats (CT, n = 21 breasts), a diet Control group with rats that developed breast cancer (CT/C, n = 4 breasts), a group of healthy rats fed a cafeteria diet (CD, n = 27 breasts), and a group of rats with breast cancer fed a cafeteria diet (CD/C, n = 3 breasts). It was also compared a Control group with healthy rats (CT, n = 21 breasts), a diet Control group with rats that developed fibroadenoma (CT/F, n = 3 breasts), a group of healthy rats fed a cafeteria diet (CD, n = 27 breasts), and a group of rats with fibroadenoma fed a cafeteria diet (CD/F, n = 3 breasts). * = p-value < 0.05.
Figure 10
Figure 10
Gene expression of tumor markers in rats with reproductive senescence (102 weeks of age), comparison between samples of healthy mammary glands exposed to different diets. Regular rodent chow was used as the control (CT, n = 30 breasts), cafeteria diet (CD, n = 6 breasts) and rats that received a cafeteria diet from their fourth week of life until 98 weeks of age, with their diets replaced by regular rodent chow in the last 4 weeks of life (CD/CT, n = 14 breasts). * = p-value < 0.05.
Figure 11
Figure 11
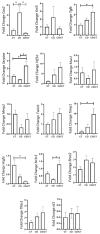
Gene expression of tumor markers in rats at the age of reproductive senescence (at 102 weeks of age) that had mammary fibroadenomas and received a cafeteria diet from their fourth week of life until 98 weeks of age, with their diets replaced by regular rodent chow in the last 4 weeks of life. Comparison between healthy mammary glands (HB, n = 14 breasts) and mammary glands with fibroadenomas (BF, n = 4 breasts). * = p-value < 0.05. ** = p-value < 0.01. *** = p-value < 0.001.
Figure 12
Figure 12
Evolutionary trajectory of mean animal weights within the Diet and Control groups among reproductive-age rats.
Figure 13
Figure 13
Evolutionary trajectory of mean animal weights within the Diet and Control groups among rats after reproductive senescence.

Similar articles

References

    1. Albini A., Bruno A., Gallo C., Pajardi G., Noonan D.M., Dallaglio K. Cancer stem cells and the tumor microenvironment: Interplay in tumor heterogeneity. Connect. Tissue Res. 2015;56:414–425. doi: 10.3109/03008207.2015.1066780. - DOI - PMC - PubMed
    1. Augsten M. Cancer-associated fibroblasts as another polarized cell type of the tumor microenvironment. Front. Oncol. 2014;4:62. doi: 10.3389/fonc.2014.00062. - DOI - PMC - PubMed
    1. Kidd S., Spaeth E., Watson K., Burks J., Lu H., Klopp A., Andreeff M., Marini F.C. Origins of the tumor microenvironment: Quantitative assessment of adipose-derived and bone marrow-derived stroma. PLoS ONE. 2012;7:e30563. doi: 10.1371/journal.pone.0030563. - DOI - PMC - PubMed
    1. Kolonin M.G. Role of adipose cells in tumor microenvironment. In: Benayahu D., Gefen A., editors. The Mechanobiology of Obesity and Related Diseases. Springer; Berlin/Heidelberg, Germany: 2014. pp. 271–294.
    1. Santander A.M., Lopez-Ocejo O., Casas O., Agostini T., Sanchez L., Lamas-Basulto E., Carrio R., Cleary M.P., Gonzalez-Perez R.R., Torroella-Kouri M. Paracrine interactions between adipocytes and tumor cells recruit and modify macrophages to the mammary tumor microenvironment: The role of obesity and inflammation in breast adipose tissue. Cancers. 2015;7:143–178. doi: 10.3390/cancers7010143. - DOI - PMC - PubMed

MeSH terms