. 2025 Jul 29;26(15):7313.
doi: 10.3390/ijms26157313.

Impact of Obesity and Ageing on the Expression of Key Mediators of SARS-CoV-2 Infection in Human Adipose Tissue

Affiliations

Impact of Obesity and Ageing on the Expression of Key Mediators of SARS-CoV-2 Infection in Human Adipose Tissue

Maria Salazar et al. Int J Mol Sci. .

Abstract

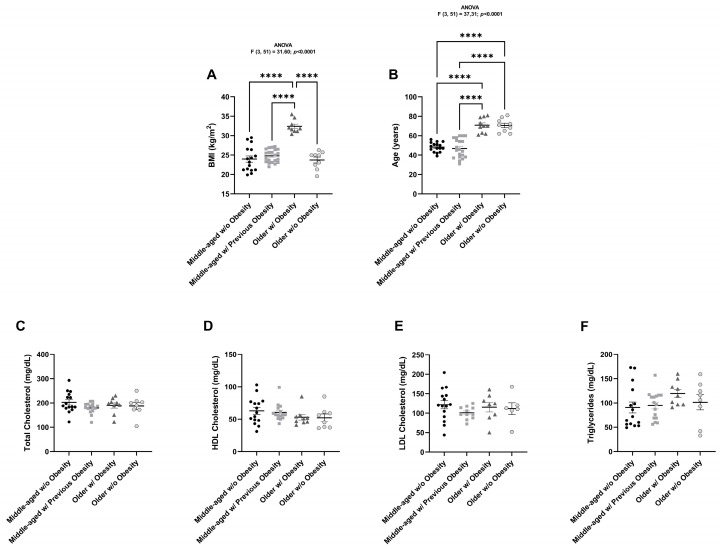
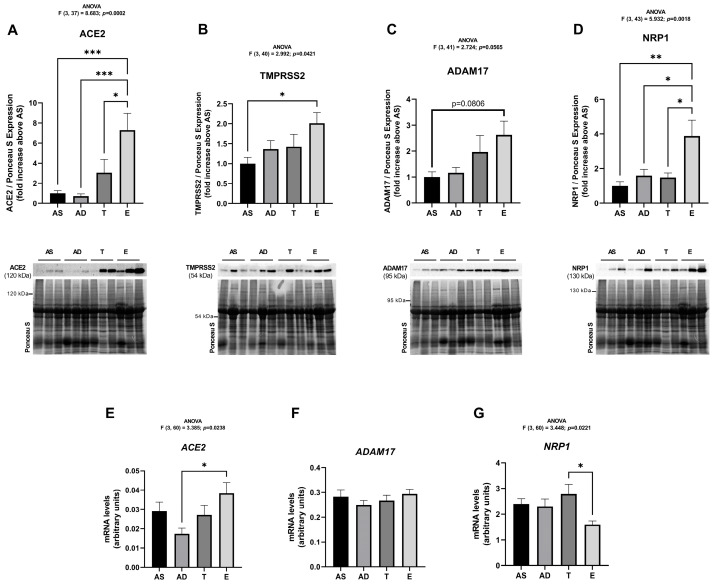
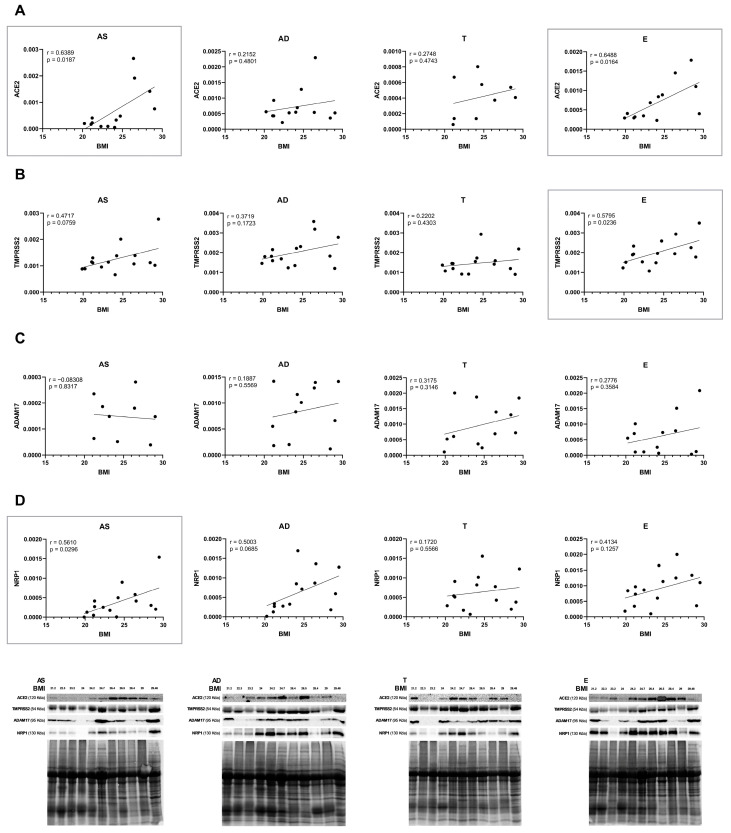
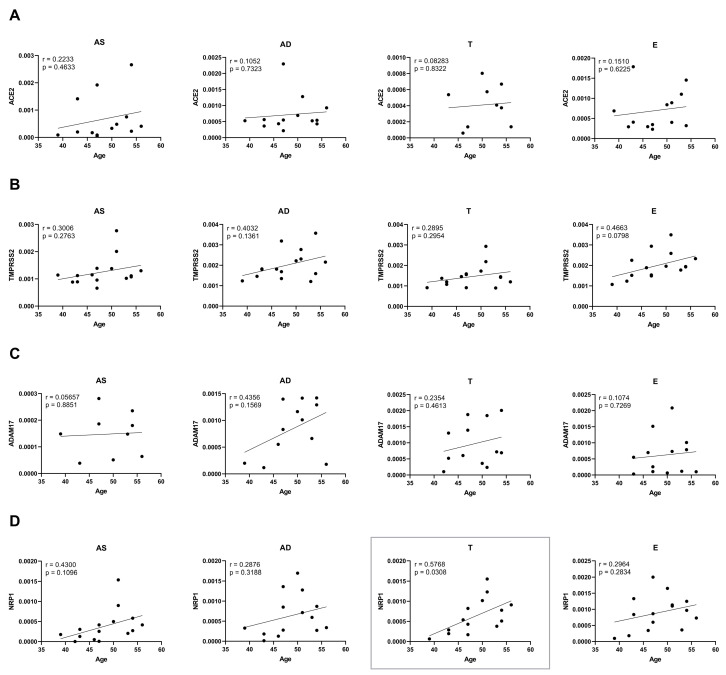
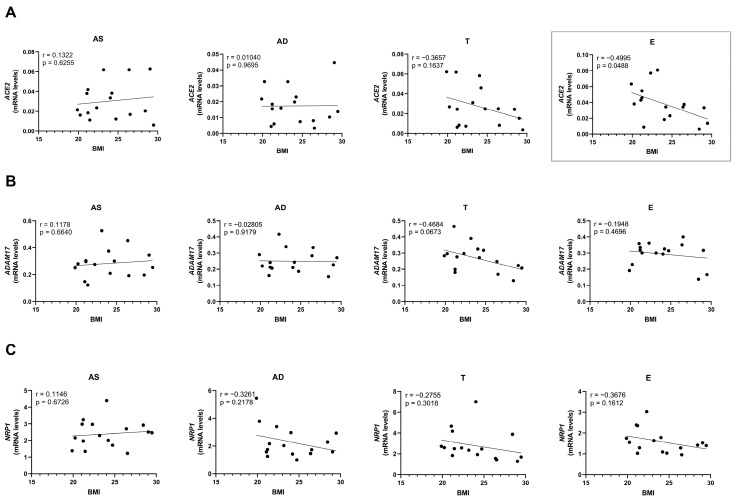
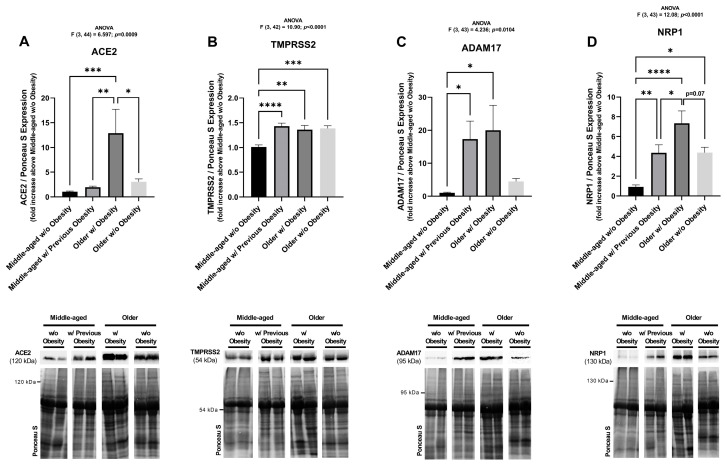
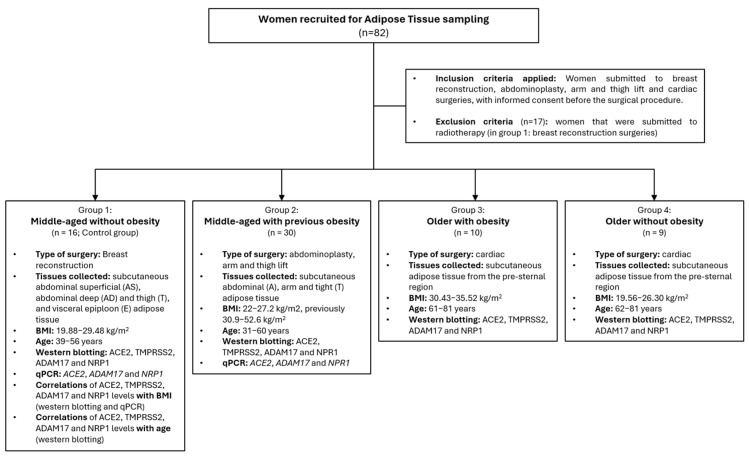
Increased body mass index (BMI) and age are associated with COVID-19 severity. SARS-CoV-2 infection occurs through ACE2 binding, with TMPRSS2, ADAM17, and NRP1 facilitating this process. This study describes how adipose tissue (AT) location, BMI, age, and obesity affect these proteins' expression. AT was collected from subcutaneous (abdominal superficial [AS], abdominal deep [AD], thigh [T]) and visceral (epiploon [E]) areas from middle-aged women without obesity (BMI 23.9 kg/m2, age 48.3 years). Subcutaneous AT was also obtained from middle-aged women with previous obesity (BMI 24.8 kg/m2, previously 41.7 kg/m2, age 46.9 years), older women with obesity (BMI 32.3 kg/m2, age 70.8 years), and older women without obesity (BMI 23.7 kg/m2, age 70.6 years). ACE2, TMPRSS2, ADAM17, and NRP1 expression was evaluated by qPCR and Western blotting. All proteins were more expressed in visceral AT. ACE2, TMPRSS2, and NRP1 positively correlated with BMI in AS and/or E, while NRP1 correlated with age in T. In subcutaneous AT, ACE2 and NRP1 were more influenced by obesity while TMPRSS2 was more age-dependent. In women with previous obesity, ACE2 and NRP1 levels decreased, while TMPRSS2 and ADAM17 remained unchanged. These findings highlight the differential influence of visceral AT, obesity, and age on the expression of SARS-CoV-2 cell entry mediators, potentially contributing to COVID-19 severity.

Keywords: ACE2; ADAM17; COVID-19; NRP1; SARS-CoV-2 receptors; TMPRSS2; adipose tissue; ageing; obesity.


Conflict of interest statement

The authors declare that they have no conflicts of interest.

Figures

Figure 1
Figure 1
Graphical representation of the anthropometric and biochemical parameters from all women studied. BMI (kg/m2) (A), age (years) (B), total cholesterol levels (mg/dL) (C), HDL cholesterol levels (mg/dL) (D), LDL cholesterol levels (mg/dL) (E), and triglyceride levels (mg/dL) (F) of middle-aged women without obesity (n = 15–16), middle-aged women with previous obesity (n = 11–21), older women with obesity (n = 8–10) and older women without obesity (n = 6–9). The results are represented as mean ± S.E.M. **** p < 0.0001, according to the one-way ANOVA, followed by Tukey’s multiple comparisons test.
Figure 2
Figure 2
Expression of SARS-CoV-2 cell entry factors in human subcutaneous (AS—abdominal superficial; AD—abdominal deep; and T—thigh) and visceral (E—epiploon) adipose tissue from middle-aged individuals without obesity (BMI from 19.88 to 29.48 kg/m2), quantified by Western blot and real-time PCR. ACE2 (A), TMPRSS2 (B), ADAM17 (C), and NRP1 (D) protein expression in AS (n = 10–12), AD (n = 11–12), T (n = 10–12) and E (n = 9–12). ACE2 (E), ADAM17 (F), and NRP1 (G) mRNA expression in AS (n = 16), AD (n = 16), T (n = 16), and E (n = 16). The results are represented as mean ± S.E.M. * p < 0.05, ** p < 0.01, and *** p < 0.001, according to the one-way ANOVA, followed by Tukey’s multiple comparisons test.
Figure 3
Figure 3
Correlations of SARS-CoV-2 receptor and co-receptor protein levels with BMI, quantified in human subcutaneous (AS—abdominal superficial; AD—abdominal deep; and T—thigh) and visceral (E—epiploon) adipose tissue from middle-aged individuals without obesity (BMI from 19.88 to 29.48 kg/m2) by Western blot. Respective representative blots are presented in the figure. ACE2 (A), TMPRSS2 (B), ADAM17 (C), and NRP1 (D) protein level correlation with BMI in AS (n = 9–15), AD (n = 12–15), T (n = 9–15), and E (n = 13–15). p-values lower than 0.05 are considered statistically significant, according to the Pearson correlation coefficient.
Figure 4
Figure 4
Correlations of SARS-CoV-2 receptor and co-receptor protein levels with age, quantified in human subcutaneous (AS—abdominal superficial; AD—abdominal deep; and T—thigh) and visceral (E—epiploon) adipose tissue from middle-aged individuals without obesity (BMI from 19.88 to 29.48 kg/m2) by Western blot. Representative blots are the same as in Figure 3. ACE2 (A), TMPRSS2 (B), ADAM17 (C), and NRP1 (D) protein level correlation with age in AS (n = 9–15), AD (n = 12–15), T (n = 9–15), and E (n = 13–15). p-values lower than 0.05 are considered statistically significant, according to the Pearson correlation coefficient.
Figure 5
Figure 5
Correlation of SARS-CoV-2 receptor and co-receptor mRNA levels with BMI, quantified in human subcutaneous (AS—abdominal superficial; AD—abdominal deep; and T—thigh) and visceral (E—epiploon) adipose tissue from middle-aged individuals without obesity (BMI from 19.88 to 29.48 kg/m2) by real-time PCR. ACE2 (A), ADAM17 (B), and NRP1 (C) mRNA level correlation with BMI in AS (n = 16), AD (n = 16), T (n = 16), and E (n = 16). p-values lower than 0.05 are considered statistically significant, according to the Pearson correlation coefficient.
Figure 6
Figure 6
Expression of SARS-CoV-2 cell entry factors in human subcutaneous adipose tissue from middle-aged women without obesity (BMI from 19.88 to 29.48 kg/m2, average age of 48.2 years), middle-aged women with previous obesity (BMI from 22.0 to 27.2 kg/m2, previously 33.5 to 52.6 kg/m2, average age of 46.9 years), older women with obesity (BMI from 30.43 to 35.52 kg/m2, average age of 70.8 years), and older women without obesity (BMI from 19.56 to 26.3 kg/m2, average age of 70.6 years), quantified by Western blot. Representative blots are indicated in the figure. ACE2 (A), TMPRSS2 (B), ADAM17 (C), and NRP1 (D) protein expression in middle-aged women without obesity (n = 13–15), middle-aged women with previous obesity (n = 14), older women with obesity (n = 10) and older women without obesity (n = 9). The results are represented as mean ± S.E.M. * p < 0.05, ** p < 0.01, *** p < 0.001, and **** p < 0.0001, according to the one-way ANOVA, followed by Tukey’s multiple comparisons test.
Figure 7
Figure 7
Flow chart summarizing all groups of patients recruited to this study divided according to age and obesity status. Inclusion/exclusion criteria, type of surgeries and respective AT anatomical location are also indicated in the figure.

Similar articles

References

    1. Chen Y., Klein S.L., Garibaldi B.T., Li H., Wu C., Osevala N.M., Li T., Margolick J.B., Pawelec G., Leng S.X. Aging in COVID-19: Vulnerability, immunity and intervention. Ageing Res. Rev. 2021;65:101205. doi: 10.1016/j.arr.2020.101205. - DOI - PMC - PubMed
    1. Salazar M., Barochiner J., Espeche W., Ennis I. COVID-19 and its relationship with hypertension and cardiovascular disease. Hipertens. Riesgo Vasc. 2020;37:176–180. doi: 10.1016/j.hipert.2020.06.003. - DOI - PMC - PubMed
    1. Cao H., Baranova A., Wei X., Wang C., Zhang F. Bidirectional causal associations between type 2 diabetes and COVID-19. J. Med. Virol. 2023;95:e28100. doi: 10.1002/jmv.28100. - DOI - PMC - PubMed
    1. Quarleri J., Delpino M.V. The interplay of aging, adipose tissue, and COVID-19: A potent alliance with implications for health. Geroscience. 2024;46:2915–2932. doi: 10.1007/s11357-023-01058-z. - DOI - PMC - PubMed
    1. Rodrigues A.R., Salazar M.J. Understanding Obesity: From Its Causes to Impact on Life. Bentham Science; Sharjah, United Arab Emirates: 2020. and Gouveia, A.M. Obesity and Adipose Tissue Remodeling; pp. 55–80.

LinkOut - more resources