. 2025 Jul 29;26(15):7342.
doi: 10.3390/ijms26157342.

Investigating Neuroprotective Effects of Berberine on Mitochondrial Dysfunction and Autophagy Impairment in Parkinson's Disease

Affiliations

Investigating Neuroprotective Effects of Berberine on Mitochondrial Dysfunction and Autophagy Impairment in Parkinson's Disease

Hae-Rim Cha et al. Int J Mol Sci. .

Abstract

Parkinson's disease (PD) is a common neurodegenerative disorder with substantial global impact. Although current therapies can provide symptomatic relief, they are often associated with high costs and adverse effects. Natural compounds with a history of traditional medicinal use have emerged as promising alternatives. In this study, we investigated the therapeutic potential and underlying mechanisms of berberine in both cellular and animal models of PD. In vitro, SH-SY5Y cells exposed to 6-hydroxydopamine (6-OHDA) exhibited decreased viability and increased oxidative stress, both of which were significantly alleviated by berberine treatment based on cell viability assays and DCFH-DA staining. Western blot analysis revealed that berberine modulated the AMPK-PGC-1α-SIRT1 signaling pathway and restored the expression of autophagy-related proteins LC3B and P62, suggesting that berberine could improve mitochondrial function and autophagy balance. In vivo studies using a 6-OHDA-induced PD mouse model further confirmed these effects, showing that berberine could improve motor function and lead to molecular changes consistent with in vitro studies. Additionally, safety evaluations indicated no significant hepatotoxicity based on AST and ALT levels. Body weight also remained stable throughout treatment. Collectively, our findings suggest that berberine can not only alleviate PD-related symptoms but also target key pathological mechanisms, supporting its potential as a therapeutic candidate for PD and other neurodegenerative diseases.

Keywords: Parkinson’s disease; autophagy impairment; berberine; mitochondria dysfunction; natural product.


Conflict of interest statement

Author Jin-Hyeob Ryu was employed by the company BIOCHESTRA Co. Ltd. The remaining authors declare that the research was conducted in the absence of any commercial or financial relationships that could be construed as a potential conflict of interest

Figures

Figure 1
Figure 1
Berberine alleviates effect of 6-OHDA on cell viability in SH-SY5Y cells. (A) Chemical structure of berberine. (B) Cell viability after treatment with 6-OHDA at various concentrations (10, 25, 50, 75, 100, 150, 200 µM) for 6 h. (C) Cell viability after treatment with berberine at various concentrations (0.5, 1, 3, 5, 10, 20, 30 µM) for 24 h. (D) Cell viability after pretreatment with berberine at various concentrations (0.5, 1, 3, 5, 10, 20 μM) for 24 h followed by treatment with 6-OHDA (100 μM) for 6 h. Cell viability was measured using MTT method. Similar results were obtained from five independent experiments. Data are presented as mean ± SD (one-way ANOVA followed by Turkey’s post hoc test). ****, p < 0.001 compared to the control group; #### p < 0.001 compared to the 6-OHDA-only treatment group.
Figure 2
Figure 2
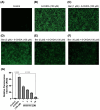
Effect of berberine on production of ROS. (A) Control group. (B) 6-OHDA-only group. (C) Berberine (1 µM) pretreatment + 6-OHDA group. (D) Berberine (3 µM) pretreatment + 6-OHDA group. (E) Berberine (5 µM) pretreatment + 6-OHDA group. (F) Berberine (10 µM) pretreatment + 6-OHDA group. (G) Statistical analysis of the relative fluorescence intensity of ROS. DCFH-DA staining results were obtained after pretreating cells with berberine at various concentrations (1, 3, 5, 10 μM) for 24 h, followed by treatment with 6-OHDA (100 μM) for 6 h. The intensity of the fluorescence was calculated using ImageJ software (version 1.53a). Similar results were obtained from three independent experiments. Data are presented as mean ± SD (one-way ANOVA followed by Turkey’s post hoc test). ****, p < 0.001 compared with 6-OHDA-only treatment group.
Figure 3
Figure 3
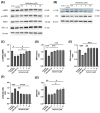
Effects of berberine on AMPK-mediated mitochondrial health and the autophagic flux balance signaling pathway inhibited by 6-OHDA in SH-SY5Y cells. (A) Levels of AMPK phosphorylation, and the expression of SIRT1 and PGC-1α proteins. (B) The expression of LC3B and p62 proteins. (C) p-AMPK/AMPK quantitative graph. (D) SIRT1/actin quantitative graph. (E) PGC-1α/actin quantitative graph. (F) LC3B-II/LC3B-I quantitative graph. (G) p62/actin quantitative graph. SH-SY5Y cells were treated with berberine (0.5, 1, 3, 5, 10 µM) for 24 h and then incubated with 100 µM 6-OHDA for a further 6 h. The intensity of the band was calculated using Image J software. β-actin acted as an internal control. Similar results were obtained from three independent experiments. All results were expressed as mean ± SD (one-way ANOVA followed by Turkey’s post hoc test) * p < 0.05, ** p < 0.01, *** p < 0.005, **** p < 0.001 6-OHDA-only treatment group compared with control group and Berberine 10 µM group).
Figure 4
Figure 4
Berberine ameliorated 6-OHDA-induced motor impairments. (A) The effects of berberine on mice body weight from day 7 to day 28 of age. (B) Latency (sec) to fall in the rotarod test. (C) Time (sec) to descend in the pole test. (D) Latency (sec) to fall in the wire hang test. (E) Beam cross time (sec) in the balance beam test; the data are presented as the mean ± SD (one-way ANOVA followed by Turkey’s post hoc test). * p < 0.05, *** p < 0.005, **** p < 0.001. 6-OHDA-only treatment group compared with control group and berberine treatment group. The circles, squares, and triangles in each graph represent individual values for that group.
Figure 5
Figure 5
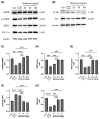
Effects of berberine on 6-OHDA inhibited AMPK-mediated mitochondrial dynamics and autophagic flux balance in animal model. (A) Levels of AMPK phosphorylation and expression of SIRT1 and PGC-1α proteins. (B) Expression levels of LC3B and p62 proteins. (C) p-AMPK/AMPK quantitative graph. (D) SIRT1/actin quantitative graph. (E) PGC-1α/actin quantitative graph. (F) LC3B-II/LC3B-I quantitative graph. (G) p62/actin quantitative graph. C57BL/6 mice were administered with berberine orally at different doses (25, 50, 100 mg/kg) for four weeks. Subsequently, mice were injected with 6-OHDA at a dose of 15 μg, and berberine was administered orally. Proteins were isolated from the right striatum tissue, which was the site of 6-OHDA injection. The intensity of the band was calculated using ImageJ software (version 1.53a). β-actin was used as an internal control. Similar results were obtained from three independent experiments. All results are expressed as mean ± SD (one-way ANOVA followed by Turkey’s post hoc test). ** p < 0.01, *** p < 0.005, **** p < 0.001. Berberine treatment group was compared with the control group and the 6-OHDA-only treatment group.
Figure 6
Figure 6
Effects of berberine on hepatotoxicity. (A) Serum ALT activity level. (B) Serum AST activity level. Liver toxicity was evaluated based on serum ALT/AST activity levels. Blood samples were obtained via orbital blood collection prior to sacrifice, followed by serum separation through centrifugation. ALT and AST levels were quantitatively assessed using an ELISA kit. Optical density (O.D) values were then measured at 450 nm. Data are presented as mean ± SD (one-way ANOVA followed by Turkey’s post hoc test). ** p < 0.01, *** p < 0.005 compared to the 6-OHDA-only treatment group.
Figure 7
Figure 7
Schematic representation of the study design for the animal model experiment. Age- and gender-matched C57BL/6 mice were divided into five groups. Control group [Group I] and group II mice (n = 4 each) received saline (0.9% NaCl) daily by oral gavage for 6 weeks. Groups III, IV, and V (n = 4 each) received 25, 50, and 100 mg/kg body weight berberine daily by oral gavage for 6 weeks. Groups II, III, IV, and V received 6-OHDA (15 μg) injection into the right striatum at week 4. After each treatment, behavioral experiments were conducted. After completing the experiments, the mice were sacrificed, and brain tissues were collected to perform various analyses.

Similar articles

References

    1. Tysnes O.B., Storstein A. Epidemiology of Parkinson’s disease. J. Neural Transm. 2017;124:901–905. doi: 10.1007/s00702-017-1686-y. - DOI - PubMed
    1. Elbaz A., Bower J.H., Maraganore D.M., McDonnell S.K., Peterson B.J., Ahlskog J.E., Schaid D.J., Rocca W.A. Risk tables for parkinsonism and Parkinson’s disease. J. Clin. Epidemiol. 2002;55:25–31. doi: 10.1016/S0895-4356(01)00425-5. - DOI - PubMed
    1. Schneider R.B., Iourinets J., Richard I.H. Parkinson’s disease psychosis: Presentation, diagnosis and management. Neurodegener. Dis. Manag. 2017;7:365–376. doi: 10.2217/nmt-2017-0028. - DOI - PubMed
    1. Zeng X.S., Geng W.S., Jia J.J. Neurotoxin-Induced Animal Models of Parkinson Disease: Pathogenic Mechanism and Assessment. ASN Neuro. 2018;10:1759091418777438. doi: 10.1177/1759091418777438. - DOI - PMC - PubMed
    1. Blandini F., Armentero M.T. Animal models of Parkinson’s disease. FEBS J. 2012;279:1156–1166. doi: 10.1111/j.1742-4658.2012.08491.x. - DOI - PubMed

MeSH terms

LinkOut - more resources