. 2025 Jul 30;26(15):7348.
doi: 10.3390/ijms26157348.

Genome-Wide Identification and Expression Analysis of the Fructose-1,6-Bisphosphate Aldolase (FBA) Gene Family in Sweet Potato and Its Two Diploid Relatives

Affiliations

Genome-Wide Identification and Expression Analysis of the Fructose-1,6-Bisphosphate Aldolase (FBA) Gene Family in Sweet Potato and Its Two Diploid Relatives

Zhicheng Jiang et al. Int J Mol Sci. .

Abstract

Fructose-1,6-bisphosphate aldolase (FBA; EC 4.1.2.13) is a key enzyme in glycolysis and the Calvin cycle, which plays crucial roles in carbon allocation and plant growth. The FBA family genes (FBA s) have been identified in several plants. However, their presence and roles in sweet potato remain unexplored. In this study, a total of 20 FBAs were identified in sweet potato and its wild wild diploidrelatives, including seven in sweet potato (Ipomoea batatas, 2n = 6x = 90), seven in I. trifida (2n = 2x = 30), and six in I. triloba (2n = 2x = 30). Their protein physicochemical properties, chromosomal localization, phylogenetic relationship, gene structure, promoter cis-elements, and expression patterns were systematically analyzed. The conserved genes and protein structures suggest a high degree of functional conservation among FBA genes. IbFBAs may participate in storage root development and starch biosynthesis, especially IbFBA1 and IbFBA6, which warrant further investigation as candidate genes. Additionally, the FBAs could respond to drought and salt stress. They are also implicated in hormone crosstalk, particularly with ABA and GA. This work provides valuable insights into the structure and function of FBAs and identifies candidate genes for improving yield, starch content, and abiotic stress tolerance in sweet potatoes.

Keywords: Fructose-1,6-bisphosphate aldolase; Ipomoea trifida; Ipomoea triloba; abiotic stress; hormone crosstalk; starch biosynthesis; storage root development; sweet potato.


Conflict of interest statement

The authors declare no conflicts of interest.

Figures

Figure 1
Figure 1
Chromosomal localization and distribution of FBAs in I. batatas (A), I. trifida (B), and I. triloba (C). The bars represent chromosomes. The chromosome numbers are displayed on the left side, and the gene names are displayed on the right side. The relative chromosomal localization of each FBA gene is marked on the black line of the right side and indicated by the unit Mbp. The stripes on chromosomes represent the density of chromosomes. (D) Syntenic analysis of I. batatas, I. trifida, and I. triloba FBAs. Chromosomes of I. batatas, I. trifida, and I. triloba are shown in different colors. The approximate positions of IbFBAs, ItfFBAs, and ItbFBAs are marked with short black lines on the chromosomes. Red curves denote the syntenic relationships between I. batatas and I. trifida FBAs.
Figure 2
Figure 2
Phylogenetic analysis of FBAs in I. batatas, I.triloba, I. trifida, A. thaliana, and S. tuberosum. Based on the neighbor-joining method with 1000 bootstrap replicates, a total of 37 FBAs were divided into four groups (groups I, II, III, and IV, filled with orange, green, blue, and purple, respectively). The claret circles represent seven IbFBAs in I. batatas. The purple squares represent seven ItfFBAs in I. trifida. The yellow stars represent six ItbFBAs in I. triloba. The green triangles represent eight AtFBAs in A. thaliana. The brown triangles represent nine StFBAs in S. tuberosum.
Figure 3
Figure 3
Conserved motifs and exon–intron structure analysis of FBAs in I. batatas, I. trifida, and I. triloba. (A) The phylogenetic tree showed that FBAs were divided into four subgroups, and the ten conserved motifs were shown in different colors. The claret circles represent IbFBAs. (B) Exon–intron structures of FBAs. The green boxes, yellow boxes, and black lines represent CDS, UTRs, and introns, respectively.
Figure 4
Figure 4
Cis-element analysis in the promoters of FBAs from I. batatas, I. trifida, and I. triloba. The cis-elements were divided into five broad categories. The degree of red colors represents the number of cis-elements in the promoters of FBAs.
Figure 5
Figure 5
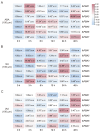
Expression analysis of FBAs in different organs of I. batatas, I. trifida, and I. triloba. (A) Expression analysis of IbFBAs in the leaf, stem, and storage root of I. batatas. The values were determined by qRT-PCR from three biological replicates consisting of pools of three plants, and the results were analyzed using the comparative CT method. The expression level of the leaf is determined as “1”. Fold change ± SD is shown in the boxes. (**) and (*) indicate significant difference at p < 0.01 and p < 0.05, respectively, based on the Student’s t-test compared to the leaf. (B) Expression patterns of ItfFBAs in the flower, leaf, stem, root1, and root2 of I. trifida. (C) Expression patterns of ItbFBAs in the flower, leaf, stem, root1, and root2 of I. triloba. The FPKM values are shown in the boxes.
Figure 6
Figure 6
Expression analysis of IbFBAs at different developmental stages of the H283 storage roots (i.e., 20, 30, 40, 50, 60, 70, 80, 90, 100, and 130 DAP) using qRT-PCR. (A) Expression analysis of IbFBAs at different developmental stages of the Taizhong 6 storage roots (i.e., FR, DR, and MR). The FPKM values are shown in the boxes. (B) Expression analysis of IbFBAs at different developmental stages of the Jishu 29 and Jishu 25 storage roots (i.e., 32, 46, and 67 DAP). The FPKM values are shown in the boxes. (C) Expression analysis of IbFBAs at different developmental stages of the Jishu 25 storage roots (i.e., 30, 45, 60, 75, 90, 105, and 120 DAP) using qRT-PCR. The values were determined via qRT-PCR from three biological replicates consisting of pools of three plants, and the results were analyzed using the comparative CT method. The expression level of 30 DAP is determined as “1”. Fold change ± SD is shown in the boxes. (**) and (*) indicate significant difference at p < 0.01 and p < 0.05, respectively, based on the Student’s t-test compared to 30 DAP.
Figure 7
Figure 7
Expression analysis of IbFBAs in sweet potato lines with different starch contents. The values were determined using qRT-PCR from three biological replicates consisting of pools of three plants, and the results were analyzed using the comparative CT method. The expression level of Jishu 33 is determined as “1”. Fold change ± SD is shown in the boxes. (**)indicates significant difference at p < 0.01 based on the Student’s t-test compared to Jishu 33.
Figure 8
Figure 8
Expression analysis of IbFBAs in sweet potato under drought and salt stresses. (A) Expression analysis of IbFBAs in the drought-tolerant line Xu55-2 under PEG6000 stress. The values were determined with the qRT-PCR from three biological replicates consisting of pools of three plants, and the results were analyzed using the comparative CT method. The expression level of 0 h is determined as “1”. Fold change ± SD is shown in the boxes. (**) and (*) indicate significant difference at p < 0.01 and p < 0.05, respectively, based on the Student’s t-test compared to 0 h. (B) Expression analysis of IbFBAs in the salt-sensitive variety NL54 and salt-tolerant line Jishu 26 under NaCl stress. The FPKM values are shown in the boxes.
Figure 9
Figure 9
Expression analysis of IbFBAs in response to different hormones in sweet potato line Jishu 25: (A) ABA. (B) GA3. (C) IAA. The values were determined using the qRT-PCR from three biological replicates consisting of pools of three plants, and the results were analyzed using the comparative CT method. The expression level of 0 h is determined as “1”. Fold change ± SD is shown in the boxes. (**) and (*) indicate significant difference at p < 0.01 and p < 0.05, respectively, based on the Student’s t-test compared to 0 h.

Similar articles

References

    1. Liu Q.C. Improvement for agronomically important traits by gene engineering in sweetpotato. Breed. Sci. 2017;67:15–26. doi: 10.1270/jsbbs.16126. - DOI - PMC - PubMed
    1. Zhang H., Zhang Q., Zhai H., Gao S., Yang L., Wang Z., Xu Y., Huo J., Ren Z., Zhao N., et al. IbBBX24 promotes the jasmonic acid pathway and enhances fusarium wilt resistance in sweet potato. Plant Cell. 2020;32:1102–1123. doi: 10.1105/tpc.19.00641. - DOI - PMC - PubMed
    1. Xue L.Y., Wei Z.H., Zhai H., Xing S.H., Wang Y.X., He S.Z., Gao S.P., Zhao N., Zhang H., Liu Q.C. The IbPYL8-IbbHLH66-IbbHLH118 complex mediates the abscisic acid-dependent drought response in sweet potato. New Phytol. 2022;236:2151–2171. doi: 10.1111/nph.18502. - DOI - PubMed
    1. Li Q., Zhao H., Jin Y.L., Zhu J.C., Ma D.F. Analysis and perspectives of sweetpotato industry contributing to national food security in China. J. Jiangsu Agric. Sci. 2022;38:1484–1491.
    1. Berg I.A., Kockelkorn D., Ramos-Vera W.H., Say R.F., Zarzycki J., Hügler M., Alber B.E., Fuchs G. Autotrophic carbon fixation in archaea. Nat. Rev. Microbiol. 2010;8:447–460. doi: 10.1038/nrmicro2365. - DOI - PubMed

MeSH terms

Substances

LinkOut - more resources