. 2025 Jul 30;26(15):7353.
doi: 10.3390/ijms26157353.

The Lysine at Position 177 Is Essential to Limit the Inhibitory Capacities of Sprouty4 Protein in Normal and Cancer-Derived Cells

Affiliations

The Lysine at Position 177 Is Essential to Limit the Inhibitory Capacities of Sprouty4 Protein in Normal and Cancer-Derived Cells

Maximilian Schiwek et al. Int J Mol Sci. .

Abstract

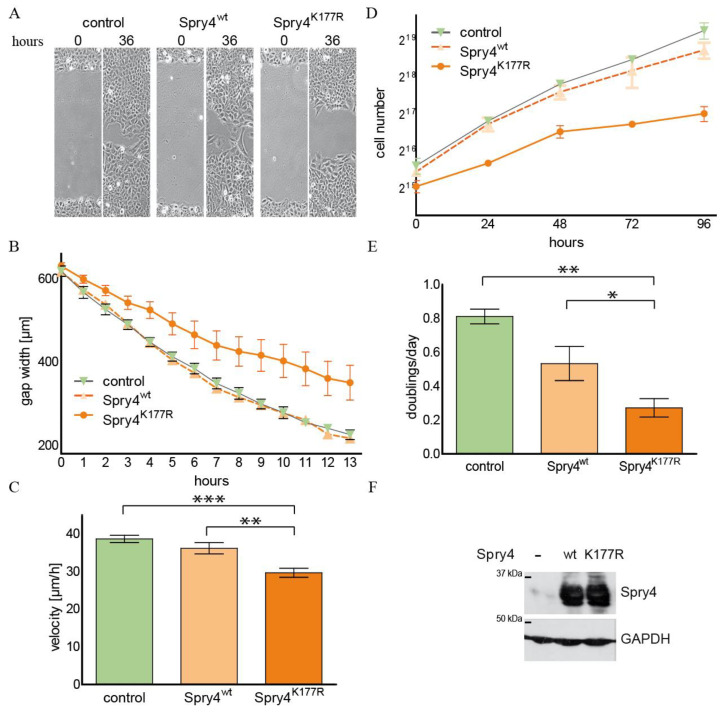
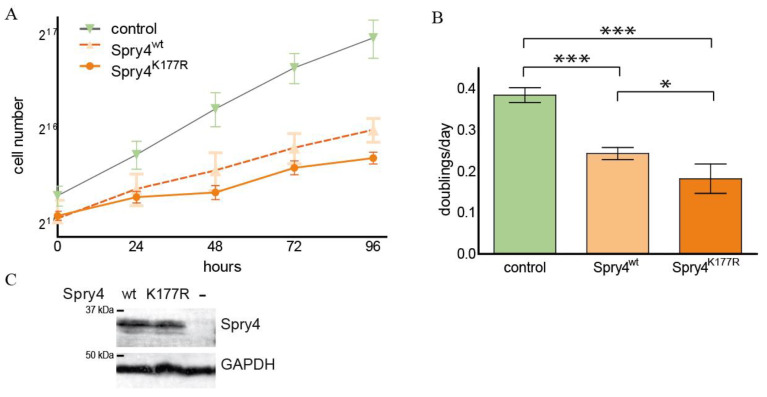
The Sprouty (Spry) proteins modulate signalling and regulate processes like cellular migration and proliferation. Here, we investigated a Spry4 alteration substituting a lysine at position 177 to an arginine, based on a mutation found in Kallmann syndrome, a genetically heterogeneous disease connected to reduced fibroblast growth factor receptor1 (FGFR) signalling. Using growth curves to evaluate proliferative and scratch assays to determine migrative capacities of the cells, in normal fibroblasts as well as in osteosarcoma-derived cells, we demonstrate that the modified Spry4K177R version hinders both processes, which the unaltered protein cannot do under the same conditions. The inhibition of these processes was accompanied by lower relative phospho-extracellular-signal-regulated kinases (pERK) levels in response to serum induction, indicating that activation of MAPK was less efficient. In contrast to the situation in these cells of mesenchymal origin, in lung cancer-derived cell lines both variants of Spry4 were able to interfere with proliferation of tested cells, and in the cells with elevated FGFR1 expression the Spry4 proteins with an alteration at codon 177 were even more effective. In summary, these data indicate that the lysine at position 177 restricts the ability of Spry4 to inhibit signal transduction at least in cells with high FGFR1 levels.

Keywords: FGFR1; Spry4; lung cancer; osteosarcoma; sprouty.


Conflict of interest statement

The authors declare no conflicts of interest.

Figures

Figure 1
Figure 1
Influence of Spry4K177R on migration and proliferation of normal human lung fibroblasts. WI38 cells were infected with adenoviruses expressing a luciferase and Spry4wt as control proteins or the examined Spry4K177R protein. Then, 24 h later, a scratch assay (AC) or a growth curve (D,E) were performed. For the scratch assay, images were taken every hour. (A) Representative images of the gap at the indicated time points are shown. (B) The width of the gap was measured every two hours using ImageJ 1.53. A graph combining the measurements of 8 different scratches is depicted in this graph. (C) Linear regression of 6 independent experiments (made in duplicates) was performed using the GraphPad Prism 5.0 program. The calculated velocities (mean ± SD) are presented in a bar plot. (D) For growth curve analysis, the cell number was determined every second day and data of a representative growth curve are depicted in a graph. (E) Using nonlinear regression as growth equation in the GraphPad Prism program, doubling times of 4 independent experiments were calculated. To obtain the doublings per day, 24 h were divided by the doubling time in hours and presented as bar blot. (F) Spry4 expression was verified by immunoblot using the indicated antibodies. Glyceraldehyde-3-phosphate dehydrogenase (GAPDH) was used as loading control. Statistical significance was calculated using one-way analysis of variance (ANOVA) with a Tukey post hoc test. ** p < 0.001; *** p < 0.0001.
Figure 2
Figure 2
Activation of ERK phosphorylation in the presence of Spry4, its variant harbouring a mutation associated with Kallmann syndrome, and a control protein. Serum-deprived cells were infected with adenoviruses expressing the indicated proteins. Luciferase was used as control. A total of 72 h after serum withdrawal, cells were lysed immediately as well as 5, 10 or 15 min after adding serum. (A) A representative immunoblot using specific antibodies against pERK1/2, total ERK1/2 and Spry4 is shown. (B) Images were scanned and densitometric analysis was performed using Image Quant. The highest value was arbitrarily set as 1. The blot summarizes the calculated pERK to ERK ratio of 4 experiments (mean ± SEM). Significance was calculated by performing a 1-way ANOVA test in GraphPad Prism. * p < 0.05; ** p < 0.001.
Figure 3
Figure 3
Migration and cell doubling of the osteosarcoma-derived cell line U2OS in the presence of Spry4K177R. Cells expressing Spry4wt, Spry4K177R or luciferase (control) due to infection with adenoviruses harbouring the respective coding sequences were analyzed 24 h postinfection (pi). (A) Brightfield pictures of representative gaps in a U2OS cell lawn using the VISITRON Live Cell Imaging System from Leica taken 0 and 36 h after scratching. (B) The measured gap width of an experiment with three scratches was depicted in a line graph and the velocity was determined by linear regression over the first 9 h. (C) Display of the calculated velocities. Each bar depicts the mean of 6 independent experiments ± SEM. (D) One growth curve performed in triplicates is presented as a graph showing the number of cells as a function of the time elapsed in hours. (E) The means of the calculated doublings/day of 5 growth curves are depicted in a bar chart. (F). Western blot showing the expression of Spry4 in the analyzed cell populations. GAPDH was used to confirm equal loading. Statistical significance was determined by 1-way ANOVA. * p < 0.05; ** p < 0.001; *** p < 0.0001.
Figure 4
Figure 4
Determination of the pERK/ERK ratio in normal fibroblasts in order to obtain an indicator of the excitability of the MAPK cascade. Serum-deprived U2OS cells expressing Spry4wt and Spry4K177R or luciferase as a control were induced by the addition of FCS 48 h pi. (A) Western blot detecting pERK, ERK or Spry4 at the time points 0, 5, 10 and 15 min after induction. (B) A densitometric analyses of the intensity of the bands was performed. The highest value of the control group was arbitrarily set as 1. The bar chart summarizes three experiments. Statistical analyses were calculated by comparing each time point between the 3 groups with 1-way ANOVA using a Tukey post hoc test. * p < 0.05; ** p < 0.001.
Figure 5
Figure 5
Scratch and growth curve assays of CRL2686 ectopically expressing the Spry4 variants. The lung adenocarcinoma-derived cells were coerced to express either Spry4wt or Spry4K177R. As controls, lacZ and/or luciferase proteins were used. (A) A series of pictures of the cells expressing the designated proteins before and 20 h after application of a scratch. (B) The hourly measured distances between the migration fronts were plotted against the time in a line graph. (C) Using linear regression by GraphPad Prism program, the velocity of 6 independent assays (performed in triplicates) were calculated. (D) Cells were counted daily over a time span of 120 h and the numbers of 3 to 5 independent experiments are shown in the form of a line diagram. (E) Bar chart illustrating the doublings per day of CRL2868 cells expressing a control, Spry4wt or Spry4K177R protein. Each bar represents the mean ± SD of 6 experiments that were performed independently. Statistical significance was established by 1-way ANOVA post hoc Tukey test. *** p < 0.0001. (F) Using immunoblot, the levels of Spry4 were visualized.
Figure 6
Figure 6
Cell proliferation of Spry4wt and Spry4K177R-expressing DMS114 cells. The lung cancer-derived cells DMS114 were incubated for approximately 24 h with adenoviruses expressing the indicated proteins. Luciferase served as control. Subsequently, growth curves were performed. (A) Cell numbers were determined for 96 h and a semi-logarithmic diagram with a binary logarithm frame of an individual representative experiment is depicted. (B) Three experiments were performed and the collective doubling time was calculated by non-linear regression using the growth curve equation in GraphPad Prism. The results of three independent experiments are presented. One-way ANOVA with Tukey post hoc test was applied for statistical analysis. * p < 0.05, *** p< 0.0001. (C) An immunoblot verifying the ectopic expression of Spry4 using the indicated virus.
Figure 7
Figure 7
FGFR1 expression in the investigated cell lines. Logarithmically growing cells were lysed and the extracts obtained were analyzed by immunoblotting using the indicated antibodies.

Similar articles

References

    1. Itoh N., Ornitz D.M. Fibroblast growth factors: From molecular evolution to roles in development, metabolism and disease. J. Biochem. 2011;149:121–130. doi: 10.1093/jb/mvq121. - DOI - PMC - PubMed
    1. Goetz R., Mohammadi M. Exploring mechanisms of FGF signalling through the lens of structural biology. Nat. Rev. Mol. Cell Biol. 2013;14:166–180. doi: 10.1038/nrm3528. - DOI - PMC - PubMed
    1. Liu Q., Huang J., Yan W., Liu Z., Liu S., Fang W. FGFR families: Biological functions and therapeutic interventions in tumors. MedComm. 2023;4:e367. doi: 10.1002/mco2.367. - DOI - PMC - PubMed
    1. Krook M.A., Reeser J.W., Ernst G., Barker H., Wilberding M., Li G., Chen H.Z., Roychowdhury S. Fibroblast growth factor receptors in cancer: Genetic alterations, diagnostics, therapeutic targets and mechanisms of resistance. Br. J. Cancer. 2021;124:880–892. doi: 10.1038/s41416-020-01157-0. - DOI - PMC - PubMed
    1. Domenichini M., Ravelli C., Corsini M., Codenotti S., Moreschi E., Gogna A., Capoferri D., Zizioli D., Bresciani R., Grillo E., et al. The D647N mutation of FGFR1 induces ligand-independent receptor activation. Biochim. Biophys. Acta Gen. Subj. 2023;1867:130470. doi: 10.1016/j.bbagen.2023.130470. - DOI - PubMed

LinkOut - more resources