. 2025 Jul 30;26(15):7369.
doi: 10.3390/ijms26157369.

Investigating the Cellular Responses to Combined Nisin and Urolithin B Treatment (7:3) in HKB-11 Lymphoma Cells

Affiliations

Investigating the Cellular Responses to Combined Nisin and Urolithin B Treatment (7:3) in HKB-11 Lymphoma Cells

Ahmad K Al-Khazaleh et al. Int J Mol Sci. .

Abstract

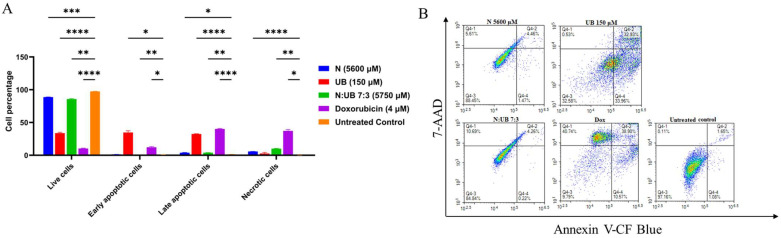
Lymphoma continues to pose a serious challenge to global health, underscoring the urgent need for new therapeutic strategies. Recently, the gut microbiome has been shown to play a potential role in regulating immune responses and influencing cancer progression. However, its molecular mechanisms of action in lymphoma remain poorly understood. This study investigates the antiproliferative and apoptotic activities of gut microbiota-derived metabolites, specifically nisin (N) and urolithin B (UB), individually and in combination 7:3 (5750 μM), against the human lymphoma cell line HKB-11. Comprehensive evaluations were performed using Alamar Blue viability assays, combination index (CI) analyses, reactive oxygen species (ROS) quantification, flow cytometry for apoptosis detection, and advanced bottom-up proteomics analyses. N and UB exhibited potent antiproliferative activity, with the 7:3 combination demonstrating strong synergistic effects (CI < 1), significantly enhancing apoptosis (p < 0.01) and ROS production (p < 0.0001) compared to the untreated control. Proteomics analyses revealed substantial alterations in proteins crucial to ribosomal biogenesis, mitochondrial function, cell cycle control, and apoptosis regulation, including a marked downregulation of ribosomal proteins (RPS27; Log2FC = -3.47) and UBE2N (Log2FC = -0.60). These findings highlight the potential of N and UB combinations as a novel and practical therapeutic approach for lymphoma treatment, warranting further in vivo exploration and clinical validation.

Keywords: apoptosis; lymphoma; nisin; postbiotics; proteomics; synergy; urolithin B.


Conflict of interest statement

The authors declare no conflicts of interest.

Figures

Figure 1
Figure 1
The effect of different concentrations of nisin (N; 5600 μM and 2800 μM), urolithin B (UB; 150 μM and 75 μM), and the combination of N and UB (7:3; 5750 μM and 2875 μM) on the production of reactive oxygen species (ROS) in the HKB-11 lymphoma cell line. For comparative purposes, doxorubicin (Dox) (4 μM) and tert-Butyl hydroperoxide (TBHP; 150 μM) were included as positive controls. The values are expressed as the mean ± SD. * indicates 0.01 < value of p < 0.05, ** indicates p < 0.01, and **** indicates p ≤ 0.0001 compared to the untreated control.
Figure 2
Figure 2
A flow cytometric assessment of the apoptotic profiles of the HKB-11 lymphoma cancer cells after 24 h of treatment. (A) The live, early apoptotic, late apoptotic, and necrotic cell percentages after 24 h treatment with nisin (N) (5600 μM), urolithin B (UB) (150 μM), N: UB (7:3; 5750 μM), doxorubicin (Dox) (4 μM), and the untreated control (n = 6), respectively. * indicates 0.01 < value of p < 0.05; ** indicates p < 0.01; *** indicates p < 0.001; and **** indicates p < 0.0001 compared to the untreated control. (B) The density plots of each drug treatment are represented, which are the most representative of the average data from the flow cytometric analyses. Q4-1 indicates necrotic cells, Q4-2 indicates late-stage apoptotic cells, Q4-3 indicates live cells, and Q4-4 indicates early-stage apoptotic cells.
Figure 3
Figure 3
Proteomic profiling of nisin (N)-treated HKB-11 cells reveals distinct molecular responses. (A) Ingenuity Pathway Analysis (IPA) graphical summary depicting enriched biological pathways and molecular functions based on significantly regulated proteins following treatment with N (5600 µM). Orange nodes represent predicted activation, blue nodes indicate predicted inhibition, and grey nodes show no prediction. Solid arrows denote direct interactions, while dashed arrows represent inferred interactions. (B) Volcano plot showing global changes in protein expression between nisin-treated vs. untreated HKB-11 cells. Red dots indicate significantly upregulated proteins, blue dots indicate significantly downregulated proteins, and grey dots represent non-significant changes or proteins that do not meet analysis thresholds. Significance was determined by absolute log2 fold change ≥ 0.58 and Q-value ≤ 0.05. Prominent up- and down-regulated proteins are labelled, highlighting key alterations in response to nisin treatment.
Figure 4
Figure 4
Proteomic analysis reveals cellular pathways modulated by urolithin B (UB) treatment in HKB-11 cells. (A) An Ingenuity Pathway Analysis (IPA) graphical summary highlighting two major biologically enriched themes derived from significantly regulated proteins following treatment with UB (150 µM). Coloured nodes represent predicted pathway activity: orange indicates predicted activation, blue indicates predicted inhibition, and grey indicates no prediction. Arrows show relationships—solid for direct and dashed for inferred interactions. (B) A volcano plot displaying the distribution of differentially expressed proteins between urolithin B-treated and untreated HKB-11 cells. Red dots represent significantly upregulated proteins, blue dots represent significantly downregulated proteins, and grey dots indicate proteins that did not meet the threshold for significance. Differential expression was defined by an absolute log2 fold change ≥ 0.58 and a Q-value ≤ 0.05. Select significantly altered proteins are annotated, illustrating the molecular impact of urolithin B on cellular protein networks.
Figure 5
Figure 5
Proteomic profiling of HKB-11 cells reveals distinct molecular responses to the synergistic combination of nisin (N) and urolithin B (UB). (A) An Ingenuity Pathway Analysis (IPA) graphical summary illustrating two enriched biological themes arising from significantly modulated proteins following treatment with a synergistic combination of nisin (N) and urolithin B (UB) in a 7:3 ratio (5750 µM total), compared to mono-treatments with N (5600 µM) or UB (150 µM). Nodes represent molecular functions or regulators: orange indicates predicted activation, blue indicates predicted inhibition, and grey denotes neutral or no prediction. Solid and dashed lines indicate direct and inferred molecular interactions, respectively. (B) Volcano plot showing differentially expressed proteins unique to the combination treatment versus individual monotherapies. Proteins meeting the significance criteria (absolute log2 fold change ≥ 0.58 and Q-value ≤ 0.05) are highlighted: red for upregulated and blue for downregulated proteins. Grey dots indicate proteins not significantly changed. Labelled proteins represent key effectors that may contribute to the enhanced anticancer activity observed with the combination therapy.
Figure 6
Figure 6
Comparative pathway analysis of proteomic responses to combination vs. monotherapies in HKB-11 cells. Ingenuity Pathway Analysis (IPA) was used to compare significant proteomic changes in HKB-11 lymphoma cells treated with a combination of nisin (N) and urolithin B (UB) (7:3 ratio; 5750 µM) versus monotherapies (N: 5600 µM; UB: 150 µM). Three categories of enrichment are shown: (A) Canonical pathways were selected based on Benjamini–Hochberg (BH)-corrected p values ≤ 0.001 and an absolute activation Z-score ≥ 2. (B) Upstream regulators (genes/proteins) were inferred using the same statistical threshold (p ≤ 0.001) and an absolute Z-score ≥ 3. (C) Enriched diseases and biological functions were filtered by p ≤ 0.001 and an absolute Z-score ≥ 2. The colour intensity represents the activation Z-score of predicted activation (orange) or inhibition (blue), while dotted entries indicate terms with low predicted activation/inhibition (|Z| ≤ 1).

Similar articles

References

    1. Swerdlow S.H., Campo E., Pileri S.A., Harris N.L., Stein H., Siebert R., Advani R., Ghielmini M., Salles G.A., Zelenetz A.D. The 2016 revision of the World Health Organization classification of lymphoid neoplasms. Blood J. Am. Soc. Hematol. 2016;127:2375–2390. doi: 10.1182/blood-2016-01-643569. - DOI - PMC - PubMed
    1. Ferlay J., Ervik M., Lam F., Colombet M., Mery L., Piñeros M., Znaor A., Soerjomataram I., Bray F. Global Cancer Observatory: Cancer Today. International Agency for Research on Cancer; Lyon, France: 2020. Cancer Tomorrow, 2021.
    1. Al-Khazaleh A.K., Chang D., Münch G.W., Bhuyan D.J. The gut connection: Exploring the possibility of implementing gut microbial metabolites in lymphoma treatment. Cancers. 2024;16:1464. doi: 10.3390/cancers16081464. - DOI - PMC - PubMed
    1. Zhang C., Wang Y., Cheng L., Cao X., Liu C. Gut microbiota in colorectal cancer: A review of its influence on tumor immune surveillance and therapeutic response. Front. Oncol. 2025;15:1557959. doi: 10.3389/fonc.2025.1557959. - DOI - PMC - PubMed
    1. Sadrekarimi H., Gardanova Z.R., Bakhshesh M., Ebrahimzadeh F., Yaseri A.F., Thangavelu L., Hasanpoor Z., Zadeh F.A., Kahrizi M.S. Emerging role of human microbiome in cancer development and response to therapy: Special focus on intestinal microflora. J. Transl. Med. 2022;20:301. doi: 10.1186/s12967-022-03492-7. - DOI - PMC - PubMed

LinkOut - more resources