. 2025 Aug 1;26(15):7421.
doi: 10.3390/ijms26157421.

Identification of Differentially Expressed Genes and Pathways in Non-Diabetic CKD and Diabetic CKD by Integrated Human Transcriptomic Bioinformatics Analysis

Affiliations

Identification of Differentially Expressed Genes and Pathways in Non-Diabetic CKD and Diabetic CKD by Integrated Human Transcriptomic Bioinformatics Analysis

Clara Barrios et al. Int J Mol Sci. .

Abstract

Chronic kidney disease (CKD) is a heterogeneous condition with various etiologies, including type 2 diabetes mellitus (T2D), hypertension, and autoimmune disorders. Both diabetic CKD (CKD_T2D) and non-diabetic CKD (CKD_nonT2D) share overlapping clinical features, but understanding the molecular mechanisms underlying each subtype and distinguishing diabetic from non-diabetic forms remain poorly defined. To identify differentially expressed genes (DEGs) and enriched biological pathways between CKD_T2D and CKD_nonT2D cohorts, including autoimmune (CKD_nonT2D_AI) and hypertensive (CKD_nonT2D_HT) subtypes, through integrative transcriptomic analysis. Publicly available gene expression datasets from human glomerular and tubulointerstitial kidney tissues were curated and analyzed from GEO and ArrayExpress. Differential expression analysis and Gene Set Enrichment Analysis (GSEA) were conducted to assess cohort-specific molecular signatures. A considerable overlap in DEGs was observed between CKD_T2D and CKD_nonT2D, with CKD_T2D exhibiting more extensive gene expression changes. Hypertensive-CKD shared greater transcriptomic similarity with CKD_T2D than autoimmune-CKD. Key DEGs involved in fibrosis, inflammation, and complement activation-including Tgfb1, Timp1, Cxcl6, and C1qa/B-were differentially regulated in diabetic samples, where GSEA revealed immune pathway enrichment in glomeruli and metabolic pathway enrichment in tubulointerstitium. The transcriptomic landscape of CKD_T2D reveals stronger immune and metabolic dysregulation compared to non-diabetic CKD. These findings suggest divergent pathological mechanisms and support the need for tailored therapeutic approaches.

Keywords: diabetic chronic kidney disease; differential expression analysis; gene set enrichment analysis; non-diabetic chronic kidney disease; transcriptomics.


Conflict of interest statement

The authors declare no conflict of interest.

Figures

Figure 1
Figure 1
Study summary of dataset selection (A) and gene expression analysis (B) in chronic kidney disease. AI: Autoimmune; CKD_T2D: chronic kidney disease cohort associated with type 2 diabetes mellitus; CKD_nonT2D: chronic kidney disease cohort not associated with type 2 diabetes; GEO: Gene Expression Omnibus; HT: hypertensive. To aid interpretation, different colors were used to distinguish study cohorts: ice blue for CKD_nonT2D, mauve for CKD_nonT2D, topaz for CKD_nonT2D, and tangerine for CKD_nonT2D.
Figure 2
Figure 2
DEGs from comparing cohorts/subcohorts against healthy control samples. (A) Description of the path followed during the analysis. (±) Significative DEGs must satisfy the filter for, at least, CKD_nonT2D or one of its subcohorts, but not for all of them. Overlapping DEGs are defined as those that show an overlap between CKD_T2D and CKD_nonT2D or any of its subcohorts. (B) Venn diagrams. CKD_nonT2D and CKD-T2D overlap for glomeruli and tubulointerstitium. (lower panels) CKD_nonT2D, CKD-T2D, CKD_nonT2D_AI, and CKD_nonT2D_HT overlap for glomeruli and tubulointerstitium. (C) Summary of the differential expression analysis in glomeruli and tubulointerstitium and the proportion of DEGs in common between diabetic and non-diabetic cohorts compared to healthy, n = number of samples. DEGs: differentially expressed genes; AI: Autoimmune; CKD_T2D: chronic kidney disease cohort associated with type 2 diabetes mellitus; CKD_nonT2D: chronic kidney disease cohort not associated with type 2 diabetes; HT: hypertensive. To aid interpretation, different colors were used to distinguish study cohorts: ice blue for CKD_nonT2D, mauve for CKD_nonT2D, topaz for CKD_nonT2D, and tangerine for CKD_nonT2D.
Figure 3
Figure 3
DEGs from direct comparison between the CKD_T2D vs. CKD_nonT2D cohort/subcohorts. (A) Description of the path followed during the analysis. Overlapping DEGs are defined as those that show an overlap between CKD_T2D and CKD_nonT2D or any of its subcohorts. (B) Venn diagrams for the results of glomeruli and tubulointerstitium direct comparison with CKD_T2D (represented by purple edges). DEGs: Differentially expressed genes; CKD_T2D: chronic kidney disease cohort associated with type 2 diabetes mellitus; CKD-nonT2D: chronic kidney disease cohort not associated with type 2 diabetes; CKD_nonT2D_AI: autoimmune chronic kidney disease; CKD_nonT2D_HT: hypertension CKD. To aid interpretation, different colors were used to distinguish study cohorts: ice blue for CKD_nonT2D, mauve for CKD_nonT2D, topaz for CKD_nonT2D, and tangerine for CKD_nonT2D.
Figure 4
Figure 4
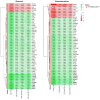
Clustered heatmap of glomerular and tubulointerstitial overlapping genes between CKD and control samples. The heatmap displays logFC values from the “CKD cohort vs. control” comparison. The color scale ranges from red (downregulation) to green (upregulation). Values marked with a double cross (‡) are statistically significant in the “cohort vs. control” comparison (adjusted p-value < 0.05). Asterisks (*) denote values that are also significant in the direct comparison between CKD-T2D and CKD-nonT2D. Genes in bold belong to a cluster presenting a higher logFC change in CKD-T2D vs. controls. Hierarchical clustering was applied to both genes and samples. CKD_T2D: chronic kidney disease cohort associated with type 2 diabetes mellitus; CKD-nonT2D: chronic kidney disease cohort not associated with type 2 diabetes; CKD_nonT2D_AI: autoimmune chronic kidney disease; CKD_nonT2D_HT: hypertension CKD.
Figure 5
Figure 5
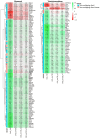
Clustered heatmap of glomerular and tubulointerstitial non-overlapping genes identified in the direct comparison between CKD-T2D and CKD-nonT2D patients. The heatmap displays logFC values from this comparison. The color scale ranges from red (downregulation) to green (upregulation), indicating the direction and magnitude of gene expression change. Genes are classified into two categories (as shown in the GROUP legend): blue indicates “Non-overlapping: direct” genes (differentially expressed only in one population), while red indicates “Non-overlapping: direct; inverse” genes—i.e., genes that show opposite regulation direction between CKD-T2D and CKD-nonT2D when compared to controls. Values marked with a double cross (‡) are statistically significant in the “CKD cohort vs. control” comparison (adjusted p-value < 0.05). Asterisks (*) denote values that are statistically significant in the direct comparison (adjusted p-value < 0.05 and |logFC| > 0.5). Genes in bold belong to a cluster presenting a higher logFC change in CKD-T2D vs. controls. Hierarchical clustering was applied to both genes and samples.
Figure 6
Figure 6
Box plots showing the expression of selected DEGs across CKD subtypes relative to healthy controls. Genes were selected for their consistent behavior in both renal compartments (glomeruli and tubulointerstitium) and for presenting some of the highest log fold change (logFC) values across comparisons. Panels (a,b) display overlapping direct genes, while panels (c,d) present non-overlapping direct and inverse genes. Expression is represented as logFC values for each comparison between CKD subgroups (CKD_T2D, CKD_nonT2D_AI, CKD_nonT2D_HT) and controls. Panels a and c correspond to glomerular data, and panels b and d to tubulointerstitial data. Data were obtained from chip definition files of GSE104948 (glomeruli) and GSE104954 (tubulointerstitium).
Figure 7
Figure 7
Significantly enriched processes in CKD_T2D but not in CKD_nonT2D. The figure illustrates the results of gene set enrichment analysis (GSEA), depicting significantly enriched biological processes in glomerular and tubulointerstitial compartments across four CKD subtypes: hypertensive CKD (CKD_nonT2D_HT), diabetic CKD (CKD_T2D), overall non-diabetic CKD (CKD_nonT2D), and autoimmune CKD (CKD_nonT2D_AI). Bars represent enrichment significance as –log(FDR), with higher values indicating greater statistical significance. The red line shows the proportion of null hypotheses in the data.
Figure 8
Figure 8
Significantly enriched processes in CKD_T2D and hypertension-CKD in glomeruli and tubulointerstitium. Depicts the results of gene set enrichment analysis (GSEA) in the glomerular and tubulointerstitial compartments across CKD cohorts. The enrichment significance is represented as –log(FDR), with higher values indicating stronger enrichment. The red line shows the proportion of null hypotheses in the data.

Similar articles

References

    1. Stevens P.E., Ahmed S.B., Carrero J.J., Foster B., Francis A., Hall R.K., Herrington W.G., Hill G., Inker L.A., Kazancıoğlu R., et al. KDIGO 2024 Clinical Practice Guideline for the Evaluation and Management of Chronic Kidney Disease. Kidney Int. 2024;105:S117–S314. doi: 10.1016/j.kint.2023.10.018. - DOI - PubMed
    1. Hallan S.I., Matsushita K., Sang Y., Mahmoodi B.K., Black C., Ishani A., Kleefstra N., Naimark D., Roderick P., Tonelli M., et al. Age and Association of Kidney Measures with Mortality and End-Stage Renal Disease. JAMA. 2012;308:2349–2360. doi: 10.1001/jama.2012.16817. - DOI - PMC - PubMed
    1. Ortiz A., Covic A., Fliser D., Fouque D., Goldsmith D., Kanbay M., Mallamaci F., Massy Z.A., Rossignol P., Vanholder R., et al. Epidemiology, Contributors to, and Clinical Trials of Mortality Risk in Chronic Kidney Failure. Lancet. 2014;383:1831–1843. doi: 10.1016/S0140-6736(14)60384-6. - DOI - PubMed
    1. Obrador G.T., Schultheiss U.T., Kretzler M., Langham R.G., Nangaku M., Pecoits-Filho R., Pollock C., Rossert J., Correa-Rotter R., Stenvinkel P., et al. Genetic and Environmental Risk Factors for Chronic Kidney Disease. Kidney Int. Suppl. 2017;7:88–106. doi: 10.1016/j.kisu.2017.07.004. - DOI - PMC - PubMed
    1. Satko S.G., Freedman B.I. The Familial Clustering of Renal Disease and Related Phenotypes. Med. Clin. N. Am. 2005;89:447–456. doi: 10.1016/j.mcna.2004.11.011. - DOI - PubMed

MeSH terms