. 2025 Aug 1;26(15):7422.
doi: 10.3390/ijms26157422.

Supervised Machine-Based Learning and Computational Analysis to Reveal Unique Molecular Signatures Associated with Wound Healing and Fibrotic Outcomes to Lens Injury

Affiliations

Supervised Machine-Based Learning and Computational Analysis to Reveal Unique Molecular Signatures Associated with Wound Healing and Fibrotic Outcomes to Lens Injury

Catherine Lalman et al. Int J Mol Sci. .

Abstract

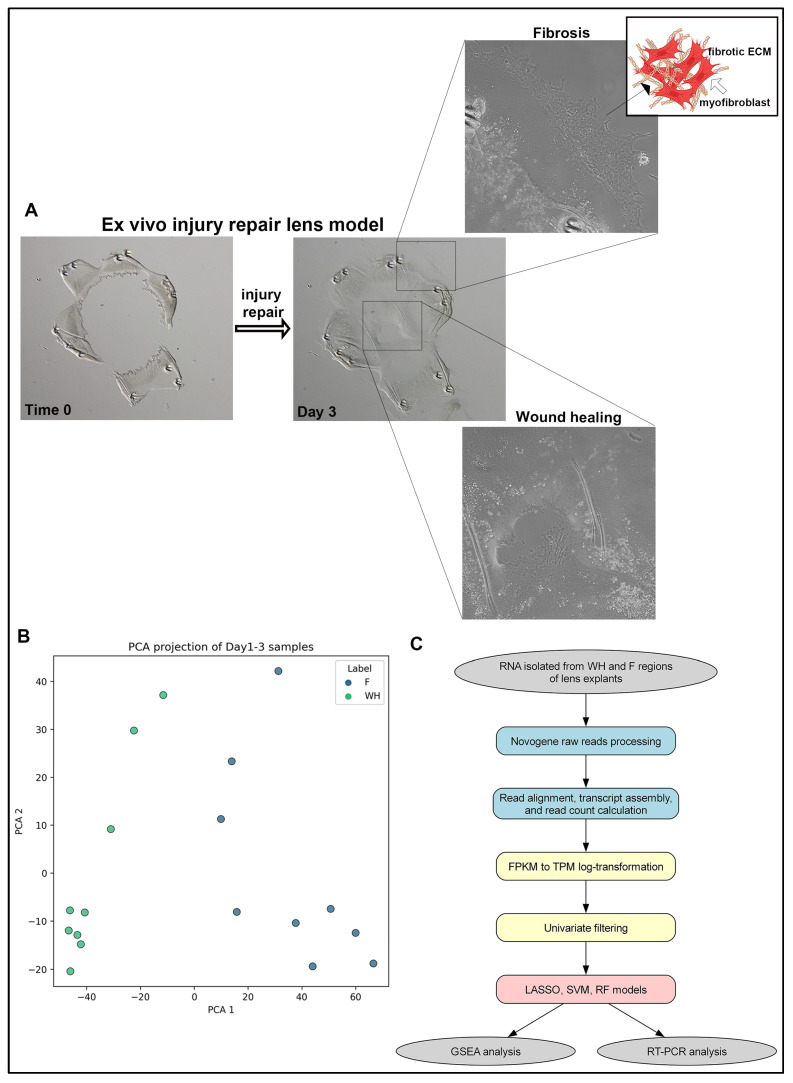
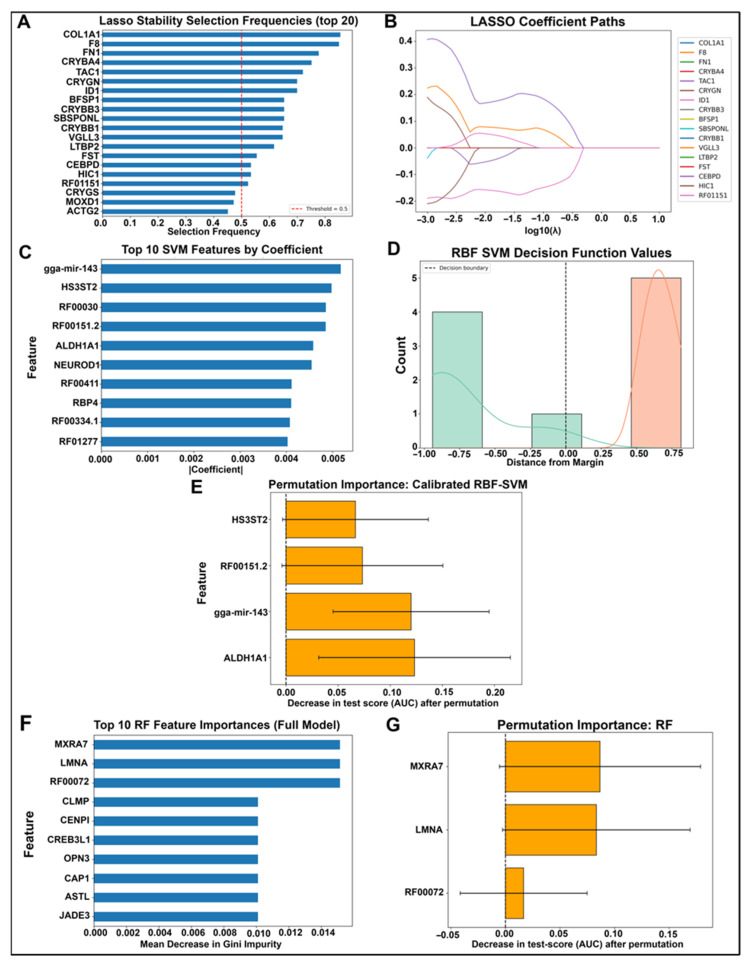
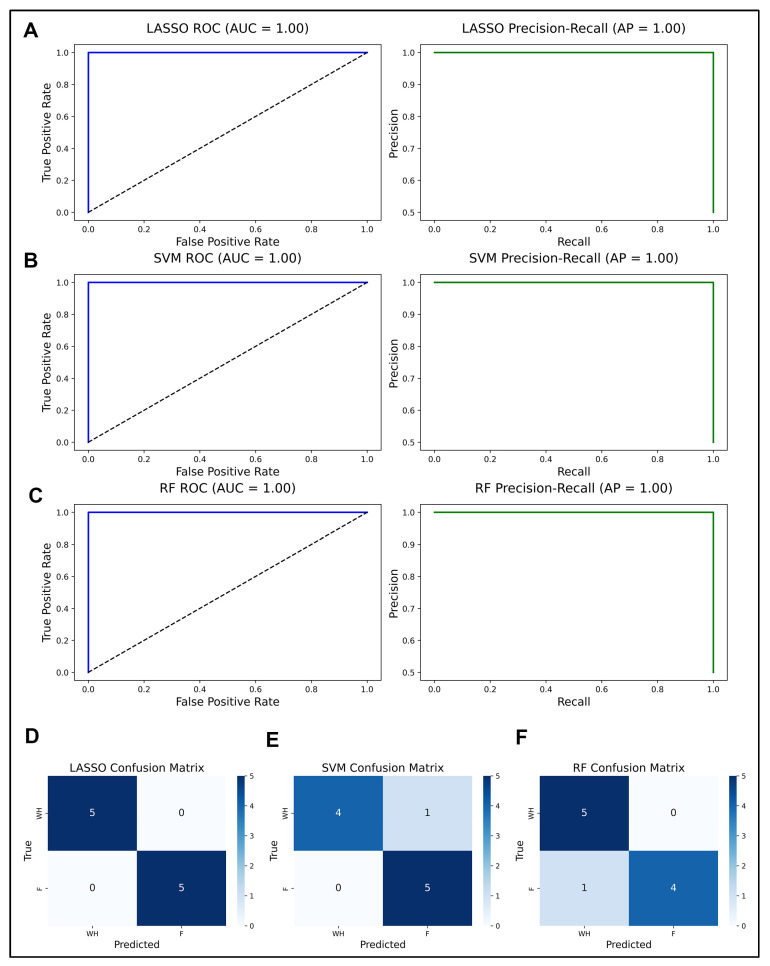
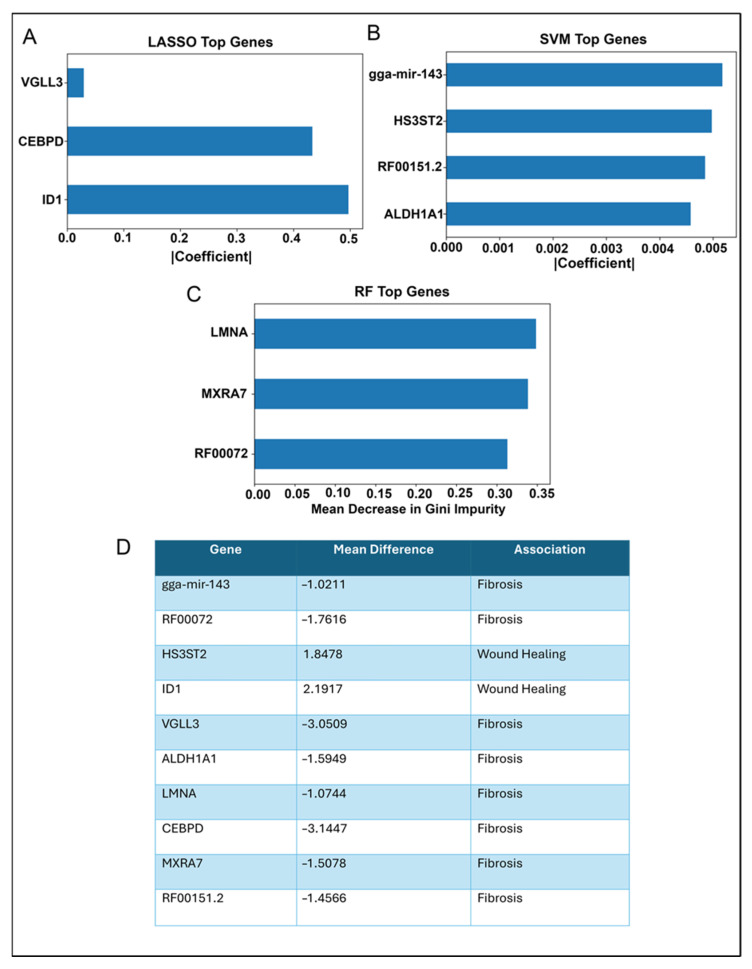
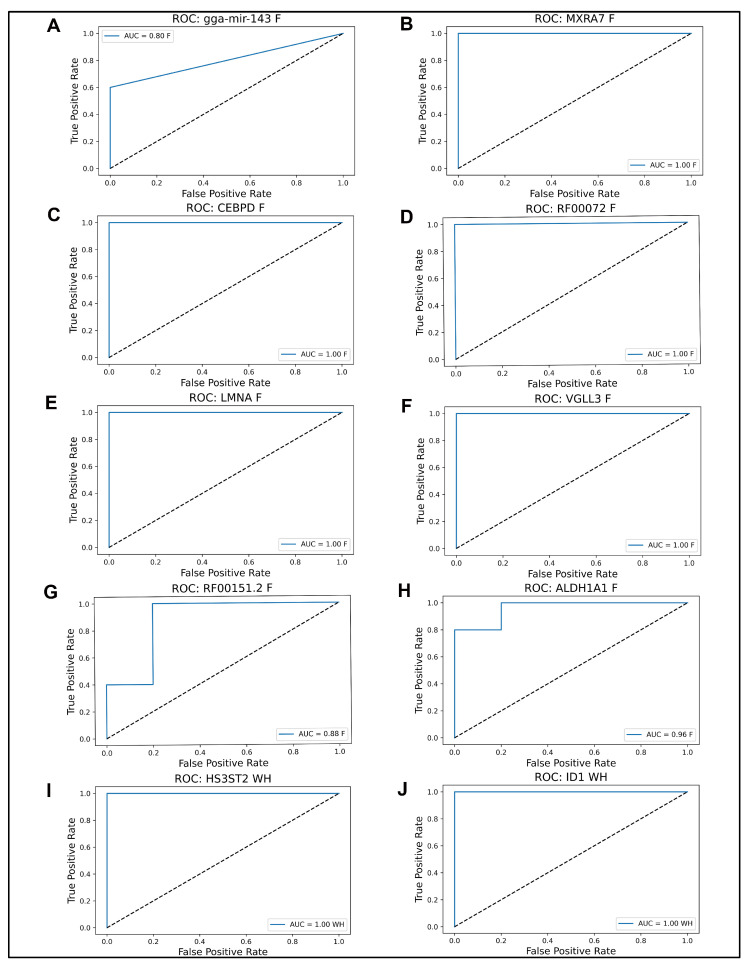
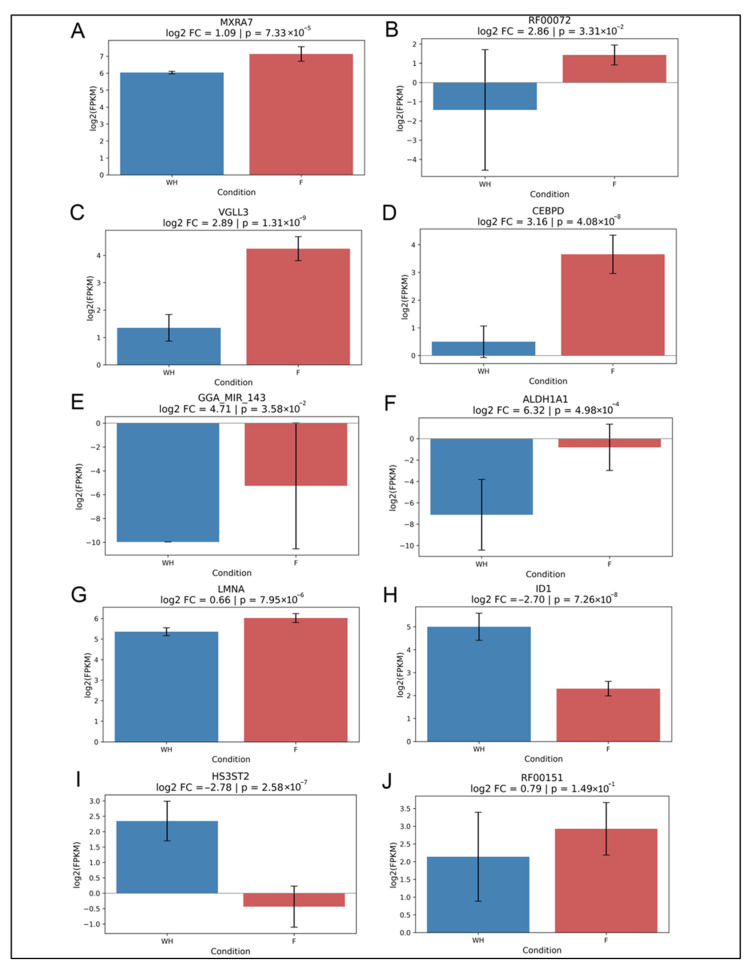
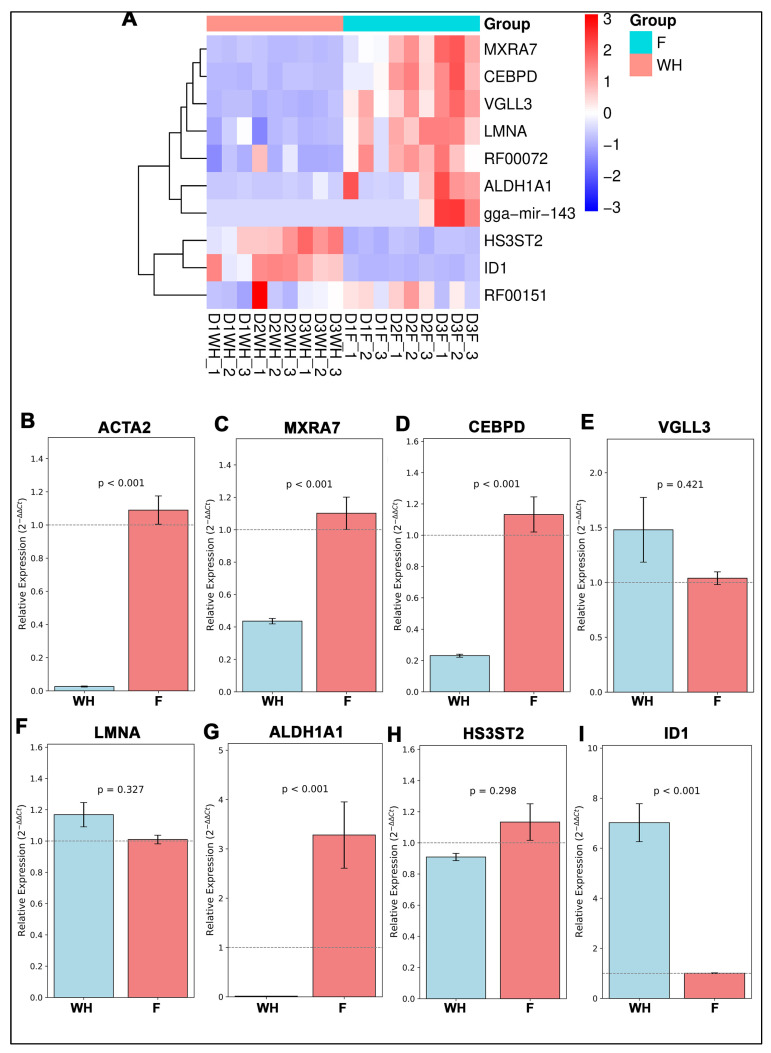
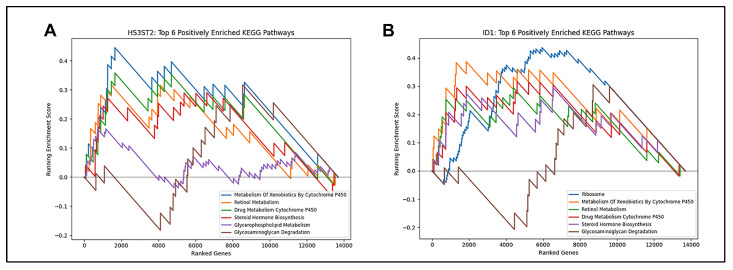
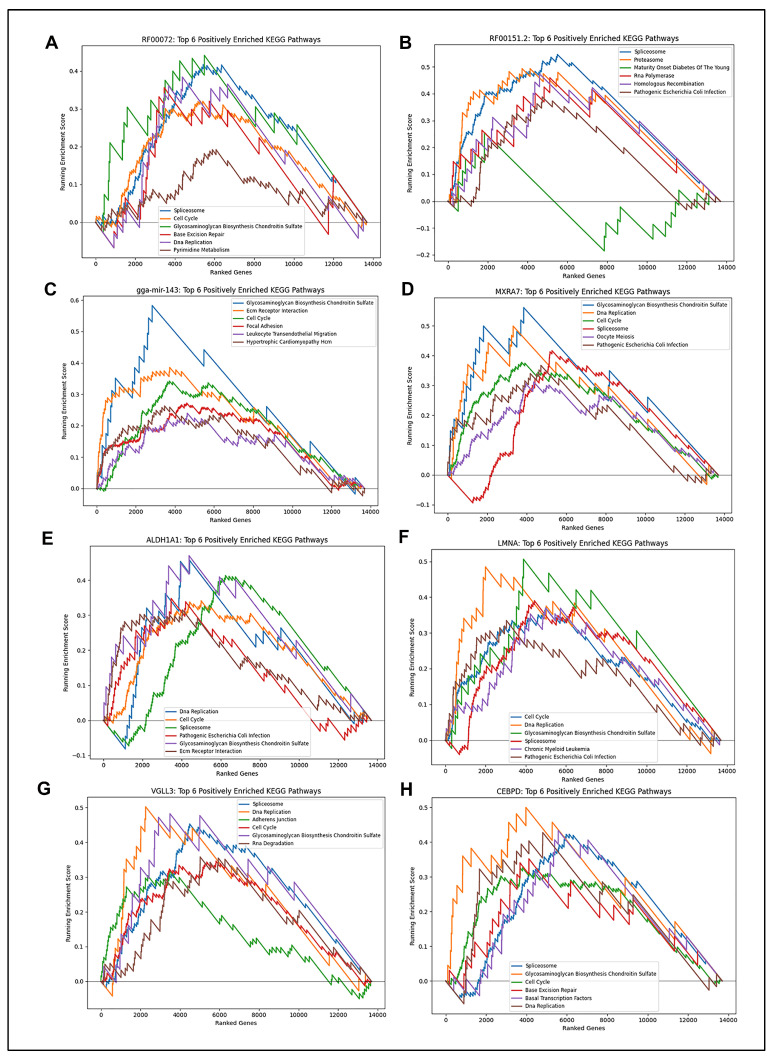
Posterior capsule opacification (PCO), a frequent complication of cataract surgery, arises from dysregulated wound healing and fibrotic transformation of residual lens epithelial cells. While transcriptomic and machine learning (ML) approaches have elucidated fibrosis-related pathways in other tissues, the molecular divergence between regenerative and fibrotic outcomes in the lens remains unclear. Here, we used an ex vivo chick lens injury model to simulate post-surgical conditions, collecting RNA from lenses undergoing either regenerative wound healing or fibrosis between days 1-3 post-injury. Bulk RNA sequencing data were normalized, log-transformed, and subjected to univariate filtering prior to training LASSO, SVM, and RF ML models to identify discriminatory gene signatures. Each model was independently validated using a held-out test set. Distinct gene sets were identified, including fibrosis-associated genes (VGLL3, CEBPD, MXRA7, LMNA, gga-miR-143, RF00072) and wound-healing-associated genes (HS3ST2, ID1), with several achieving perfect classification. Gene Set Enrichment Analysis revealed divergent pathway activation, including extracellular matrix remodeling, DNA replication, and spliceosome associated with fibrosis. RT-PCR in independent explants confirmed key differential expression levels. These findings demonstrate the utility of supervised ML for discovering lens-specific fibrotic and regenerative gene features and nominate biomarkers for targeted intervention to mitigate PCO.

Keywords: RNA sequencing; biomarker discovery; cataract surgery; fibrosis; lens; machine learning; posterior capsule opacification; repair; wound healing.


Conflict of interest statement

The authors declare no conflicts of interest.

Figures

Figure 1
Figure 1
Schematic overview of the experimental and computational workflow. (A) Ex vivo injury-repair lens model depicted at time 0 (T0) and day 3 (D3) post-injury as wound healing is being completed across the fiber-cell-denuded basement membrane (high magnification image shown of boxed area) and cells that have moved off the lens capsule (high magnification image shown of boxed area) to initiate a fibrotic response. Cell migration off the lens capsule is shown at higher magnification, and the acquisition of the fibrotic phenotype adopted in response to injury is modeled, involving emergence of αSMA+-myofibroblast cells and accumulation of fibrotic extracellular matrix (ECM). The model was created using bioRender. (B) Principal component analysis shows separation of wound healing and fibrosis samples from the model. (C) Cartoon illustration of the pipeline integrating RNA-seq with supervised machine learning. Bulk RNA-seq was performed on lens samples collected at multiple post-injury timepoints representing wound healing (WH) and fibrosis (F) outcomes. After normalization and filtering, three machine learning models (LASSO, SVM, and random forest) were trained to distinguish WH from F. Feature selection, model validation, and biological interpretation were performed in parallel.
Figure 2
Figure 2
Gene importance scores across machine learning classifiers. (A) Top 20 genes selected by LASSO regression, ranked by absolute coefficient magnitude. (B) LASSO coefficient path diagram showing the evolution of gene coefficients as a function of log(λ); vertical line indicates the optimal λ chosen by cross-validation. (C) Top 10 linear SVM features ranked by absolute coefficient values, highlighting genes with the strongest linear decision boundary contributions. (D) Histogram and kernel density plot of RBF-SVM decision function values. The x-axis shows the signed distance from the SVM decision boundary (vertical dashed line at 0), with negative values predicting fibrosis (blue bars and KDE) and positive values predicting wound healing (WH) (orange bars and KDE). KDE curves represent smoothed distributions for each class, overlaid on histograms of sample counts. (E) Permutation importance scores for the calibrated RBF-SVM model; bars show mean ± SD of importance across permutations. (F) Top 10 random forest feature importances based on mean decrease in impurity. (G) Permutation importance scores for the random forest classifier, with genes ranked by contribution to prediction accuracy.
Figure 3
Figure 3
Classifier performance metrics for WH versus fibrosis prediction. (AC) ROC and precision–recall curves for LASSO, SVM, and random forest models, respectively. (DF) Corresponding confusion matrices for each model showing prediction accuracy, sensitivity, and specificity. Performance reflects model’s ability to distinguish regenerative from fibrotic lens states.
Figure 4
Figure 4
Final gene panel with model importance scores and outcome association. (AC) Tabulated summary of the final gene set selected by at least one classifier for each machine learning tool. (D) Each gene’s average importance across models is listed, along with its dominant association (WH or F). This integrative panel reflects consensus features predictive of regenerative versus fibrotic responses.
Figure 5
Figure 5
ROC curves for individual genes in the final model panel. (AJ) ROC plots showing classification performance of each gene individually in distinguishing WH from F outcomes. AUC values indicate standalone predictive power. Genes include both pro-regenerative and pro-fibrotic markers.
Figure 6
Figure 6
Differential expression of final model genes in WH versus fibrosis. (AJ) Bar graphs showing the log2-transformed average FPKM of pooled F samples across days D1, D2, and D3, compared to the log2-transformed average of pooled WH samples from the same time points. Statistical significance was assessed using Welch’s t-test; p-values are indicated. Color coding reflects WH or F association as inferred from model behavior.
Figure 7
Figure 7
Validation of gene expression by clustered heatmap and RT-qPCR. (A) Heatmap showing RNA-seq expression log2-transformed FPKM of the final model genes across all samples, clustered by outcome. (BI) RT-PCR analysis showing relative expression (2−ΔΔCt) for identified genes and ACTA2 to validate F vs. WH on day 3 post-injury lens explants separated into WH vs. F samples. (n = 3 individual experiments) with Welch’s t-test performed to calculate statistical significance.
Figure 8
Figure 8
Gene Set Enrichment Analysis (GSEA) for model-selected genes associated with wound healing. (A,B) GSEA plots showing pathway-level enrichment scores for each final model gene associated with wound healing. The running enrichment score and leading-edge subsets are shown. Genes are linked to curated biological processes indicated on each enrichment score graph.
Figure 9
Figure 9
Gene Set Enrichment Analysis (GSEA) for model-selected genes associated with fibrosis. (AH) GSEA plots showing pathway-level enrichment scores for each final model gene associated with fibrosis. The running enrichment score and leading-edge subsets are shown. Genes are linked to curated biological processes indicated on each enrichment score graph.

Similar articles

References

    1. Zhao X., Chen J., Sun H., Zhang Y., Zou D. New insights into fibrosis from the ECM degradation perspective: The macrophage-MMP-ECM interaction. Cell Biosci. 2022;12:117. - PMC - PubMed
    1. Mayorca-Guiliani A., Leeming D., Henriksen K., Mortensen J., Nielsen S., Anstee Q., Sanyal A., Karsdal M., Schuppan D. ECM formation and degradation during fibrosis, repair, and regeneration. npj Metab. Health Dis. 2025;3:25. doi: 10.1038/s44324-025-00063-4. - DOI - PubMed
    1. Ghazal R., Wang M., Liu D., Tschumperlin D.J., Pereira N.L. Cardiac Fibrosis in the Multi-Omics Era: Implications for Heart Failure. Circ. Res. 2025;136:773–802. doi: 10.1161/CIRCRESAHA.124.325402. - DOI - PMC - PubMed
    1. Huang R., Fu P., Ma L. Kidney fibrosis: From mechanisms to therapeutic medicines. Signal Transduct. Target. Ther. 2023;8:129. doi: 10.1038/s41392-023-01379-7. - DOI - PMC - PubMed
    1. Zhang X., Zhang Y., Liu Y. Fibroblast activation and heterogeneity in fibrotic disease. Nat. Rev. Nephrol. 2025 doi: 10.1038/s41581-025-00969-8. - DOI - PubMed

LinkOut - more resources