. 2025 Aug 1;26(15):7446.
doi: 10.3390/ijms26157446.

Ectopic Recruitment of the CTCF N-Terminal Domain with Two Proximal Zinc-Finger Domains as a Tool for 3D Genome Engineering

Affiliations

Ectopic Recruitment of the CTCF N-Terminal Domain with Two Proximal Zinc-Finger Domains as a Tool for 3D Genome Engineering

Eugenia A Tiukacheva et al. Int J Mol Sci. .

Abstract

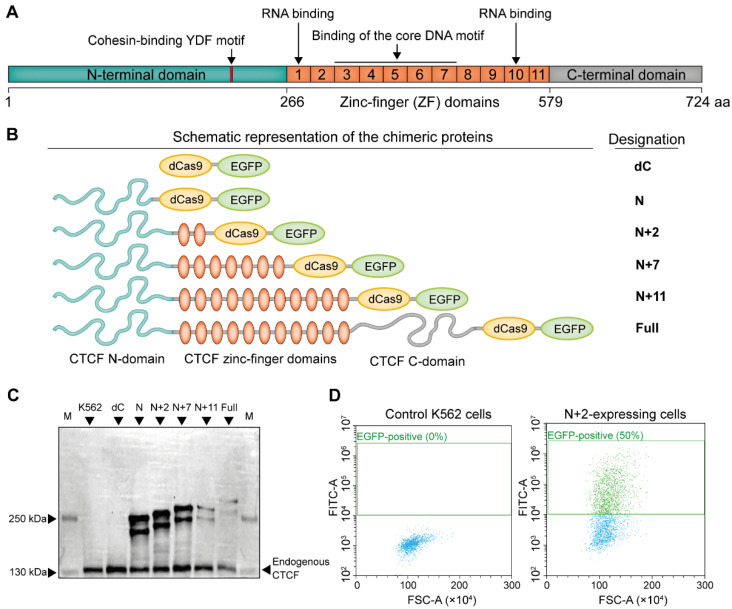
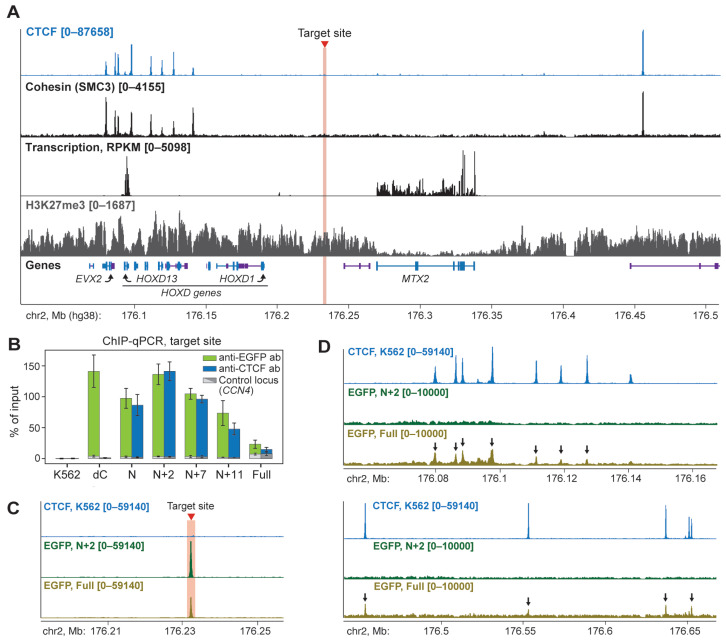
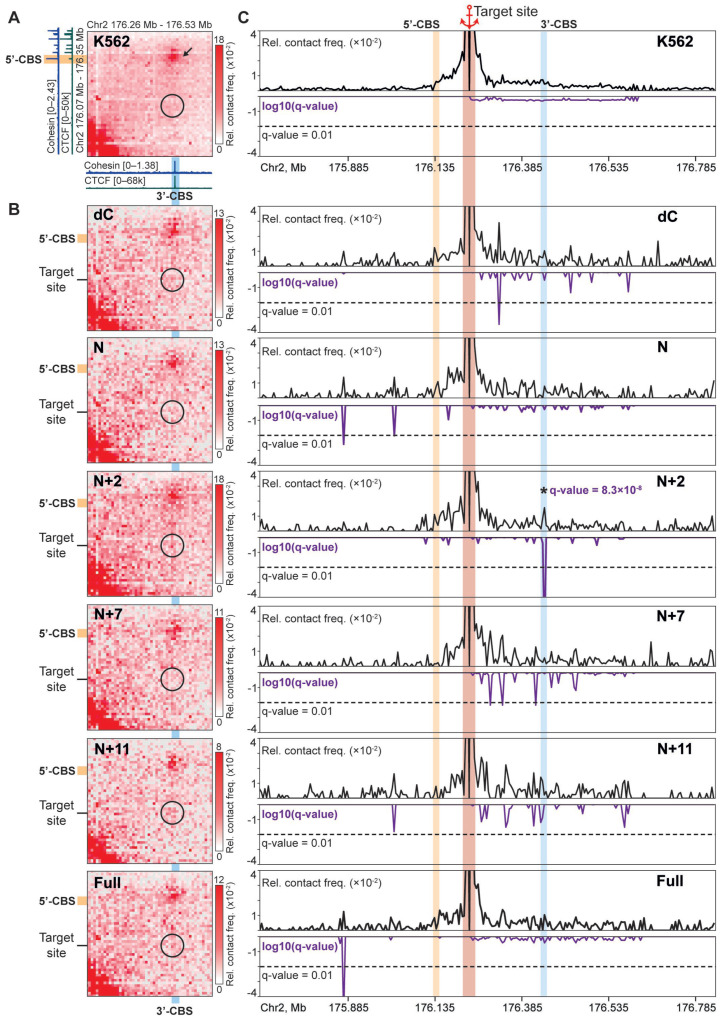
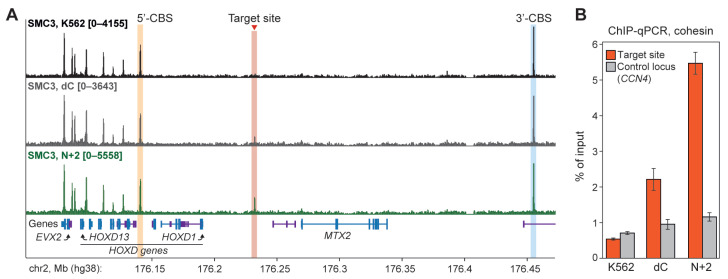
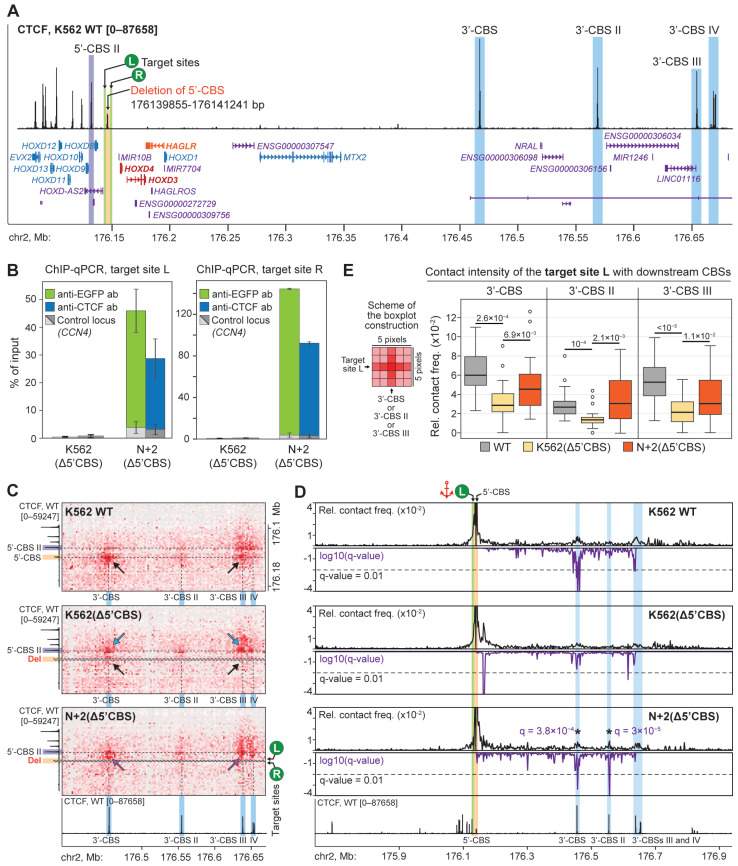
Enhancer-promoter interactions occur in the chromatin loci delineated by the CCCTC-binding zinc-finger protein CTCF. CTCF binding is frequently perturbed in genetic disorders and cancer, allowing for misregulation of genes. Here, we developed a panel of chimeric proteins consisting of either full-length or truncated CTCF fused with programmable DNA-binding module dCas9 and fluorescent tracker EGFP. We found that the recruitment of a chimeric protein based on the CTCF N-terminal domain and two zinc-finger domains to the human HOXD locus leads to the de novo formation of a spatial contact with a nearby cohesin/CTCF-bound region, anchoring several chromatin loops. This chimeric protein did not show binding to CTCF motifs and did not affect the epigenetic and transcription profile of the locus. Recruitment of this chimeric protein is also able to restore chromatin loops, lost after deletion of an endogenous CTCF-binding site. Together, our data indicate that the ectopic recruitment of the CTCF N-terminal part could be an appropriate tool for 3D genome engineering.

Keywords: 3D genome engineering; CTCF; chromatin loops; cohesin; genome spatial organization; loop extrusion.


Conflict of interest statement

The authors declare no conflict of interest.

Figures

Figure 1
Figure 1
Design and expression of CTCF-dCas9-EGFP chimeric proteins. (A) Schematic representation of the human CTCF domain organization. Location of the N-terminal, C-terminal and zinc-finger (ZF) domains relative to the amino acid (aa) sequence is shown (according to [13,25,49]). Structural features important for chromatin looping are indicated. (B) Schematic representation of the chimeric proteins developed in this work. (C) Western Blot analysis of the chimeric protein expression in K562 cells electroporated with the corresponding expression plasmids. Antibodies against the CTCF N-terminal domain were used. Calculated molecular weights of chimeric proteins N, N+2, N+7, N+11 and Full are 209, 223, 240, 254 and 270 kDa, respectively. The presence of the second band for all chimeric proteins is potentially attributed to the poly(ADP-ribosyl)ated form [28,50]. Endogenous CTCF migrates as a 130-kDa protein and serves as a loading control. K562—control non-electroporated cells. (D) Flow cytometry analysis of the control and N+2-expressing K562 cells showing the proportion of EGFP-positive (FITC-A) and live (FSC-A) cells.
Figure 2
Figure 2
N+2 chimeric protein effectively and specifically binds to the target site. (A) A snapshot from the UCSC Genome Browser [54] showing profiles of CTCF, cohesin, H3K27me3 and transcription across the HOXD gene locus (RPKM). Note that in K562 cells, HOXD genes are typically Polycomb-repressed and extensively marked with H3K27me3. However, in the used clone of K562 cells, HOXD13 expression level is relatively high, comparable to that of the housekeeping MTX2 gene. Protein-coding and non-coding RNA genes are highlighted in blue and violet, respectively. (B) ChIP-qPCR analysis of the chimeric protein binding at the target site. An amplicon within the CCN4 locus was used as a negative control. The average value of two independent biological replicates and the standard error of the mean are shown. (C) ChIP-seq analysis (RPKM) of N+2 and Full chimeric protein binding at the target site. Upper line: control K562 cells, anti-CTCF antibodies were used; middle and bottom lines: N+2- and Full-expressing cells, anti-EGFP antibodies were used. (D) Representative examples of the off-target binding of the Full chimeric protein at the endogenous CBSs (black arrows) within the HOXD locus revealed by ChIP-seq (RPKM). Upper lines: control K562 cells, anti-CTCF antibodies; middle and bottom lines: N+2- and Full-expressing cells, anti-EGFP antibodies.
Figure 3
Figure 3
N+2 chimeric protein mediates chromatin looping. (A) A snapshot of the C-TALE heatmap (5-kb resolution) for the control K562 cells, showing a loop between 5′-CBS and 3′-CBS (black arrow). A black circle designates an area of the map where a contact between the target site and 3′-CBS is expected. The color intensity is directly proportional to the C-TALE-captured contact frequency (see the color bars to the right of the heatmaps). (B) The same fragments of the C-TALE heatmaps were obtained from the K562 cells expressing dC, N, N+2, N+7, N+11 and Full chimeric proteins. (C) Virtual 4C profiles of the relative contact frequency of the target site (top panels) and FDR-adjusted p-values (q-values) of the contacts (violet plots in the bottom panels). The lower the q-value, the higher the statistical significance of the difference between the observed and expected contact frequency. The significance threshold equal to 0.01 is indicated by a dashed line. A contact between the target site and 3′-CBS in N+2-expressing cells is indicated with an asterisk.
Figure 4
Figure 4
The recruitment of N+2 chimeric protein leads to the accumulation of cohesin at the target site. (A) SMC3 ChIP-seq profiles (RPKM) obtained from control K562 cells (upper line) and from cells expressing dC (middle line) and N+2 chimeric proteins (bottom line). Protein-coding and non-coding RNA genes are highlighted in blue and violet, respectively. (B) Cohesin accumulation level at the target site as revealed by ChIP-qPCR with anti-SMC3 and anti-RAD21 antibodies (used in different biological replicates). The average value of two independent biological replicates and the standard error of the mean are shown.
Figure 5
Figure 5
The recruitment of N+2 chimeric protein partially restores lost chromatin loops. (A) A scheme of the locus illustrating the positions of 5′-CBS deletion, surrounding CBSs, target sites for the N+2 recruitment in the K562(Δ5′CBS) cells (vertical green lines) and genes, differentially expressed between WT K562 and K562(Δ5′CBS) cells (protein-coding genes HOXD4 and HOXD3, and gene of non-coding RNA HAGLR are highlighted in red and orange, respectively). (B) ChIP-qPCR analysis of the N+2 chimeric protein binding at the target sites near the 5′-CBS deletion. An amplicon within the CCN4 locus was used as a negative control. The average value of two independent biological replicates and the standard error of the mean are shown. (C) Snapshots of the C-TALE heatmaps showing contacts of the 5′-CBS and 5′-CBS II with downstream CBSs. Position of the 5′-CBS deletion is shown with the gray dashed line. Black arrows indicate contacts of the 5′-CBS with 3′-CBS and 3′-CBS III in the K562 WT cells, and the loss of these contacts in the K562(Δ5′CBS) line. Blue arrows show the emergence of contacts of the 3′-CBS and 3′-CBS III with the 5′-CBS II after deletion of the 5′-CBS. Magenta arrows denote the increased contact frequency of the target site L with the downstream CBSs in the N+2-expressing K562(Δ5′CBS) cells. Data resolution—2 kb. (D) Virtual 4C profiles of the relative contact frequency of the target site L (marked with an anchor; top panels) and FDR-adjusted p-values (q-values) of the contacts (violet plots in the bottom panels). The significance threshold equal to 0.01 is indicated by a dashed line. Contacts of the target site L with 3′-CBS and 3′-CBS II in the N+2-expressing K562 (Δ5′CBS) cells are indicated with asterisks. (E) Boxplots showing distributions of the C-TALE counts in the areas of the heatmaps corresponding to contacts of the target site L with downstream 3′-CBSs (n = 25). Horizontal bold lines represent median values. p-values are calculated in the Mann-Whitney U test.

Similar articles

References

    1. Jerkovic I., Cavalli G. Understanding 3D Genome Organization by Multidisciplinary Methods. Nat. Rev. Mol. Cell Biol. 2021;22:511–528. doi: 10.1038/s41580-021-00362-w. - DOI - PubMed
    1. Finn E.H., Pegoraro G., Brandão H.B., Valton A.-L., Oomen M.E., Dekker J., Mirny L., Misteli T. Extensive Heterogeneity and Intrinsic Variation in Spatial Genome Organization. Cell. 2019;176:1502–1515.e10. doi: 10.1016/j.cell.2019.01.020. - DOI - PMC - PubMed
    1. Ulianov S.V., Razin S.V. The Two Waves in Single-Cell 3D Genomics. Semin. Cell Dev. Biol. 2022;121:143–152. doi: 10.1016/j.semcdb.2021.05.021. - DOI - PubMed
    1. Acemel R.D., Lupiáñez D.G. Evolution of 3D Chromatin Organization at Different Scales. Curr. Opin. Genet. Dev. 2023;78:102019. doi: 10.1016/j.gde.2022.102019. - DOI - PubMed
    1. Tiukacheva E.A., Ulianov S.V., Karpukhina A., Razin S.V., Vassetzky Y. 3D Genome Alterations and Editing in Pathology. Mol. Ther. J. Am. Soc. Gene Ther. 2023;31:924–933. doi: 10.1016/j.ymthe.2023.02.005. - DOI - PMC - PubMed

LinkOut - more resources