. 2025 Aug 1;26(15):7467.
doi: 10.3390/ijms26157467.

Sulforaphane-Rich Broccoli Sprout Extract Promotes Hair Regrowth in an Androgenetic Alopecia Mouse Model via Enhanced Dihydrotestosterone Metabolism

Affiliations

Sulforaphane-Rich Broccoli Sprout Extract Promotes Hair Regrowth in an Androgenetic Alopecia Mouse Model via Enhanced Dihydrotestosterone Metabolism

Laxman Subedi et al. Int J Mol Sci. .

Abstract

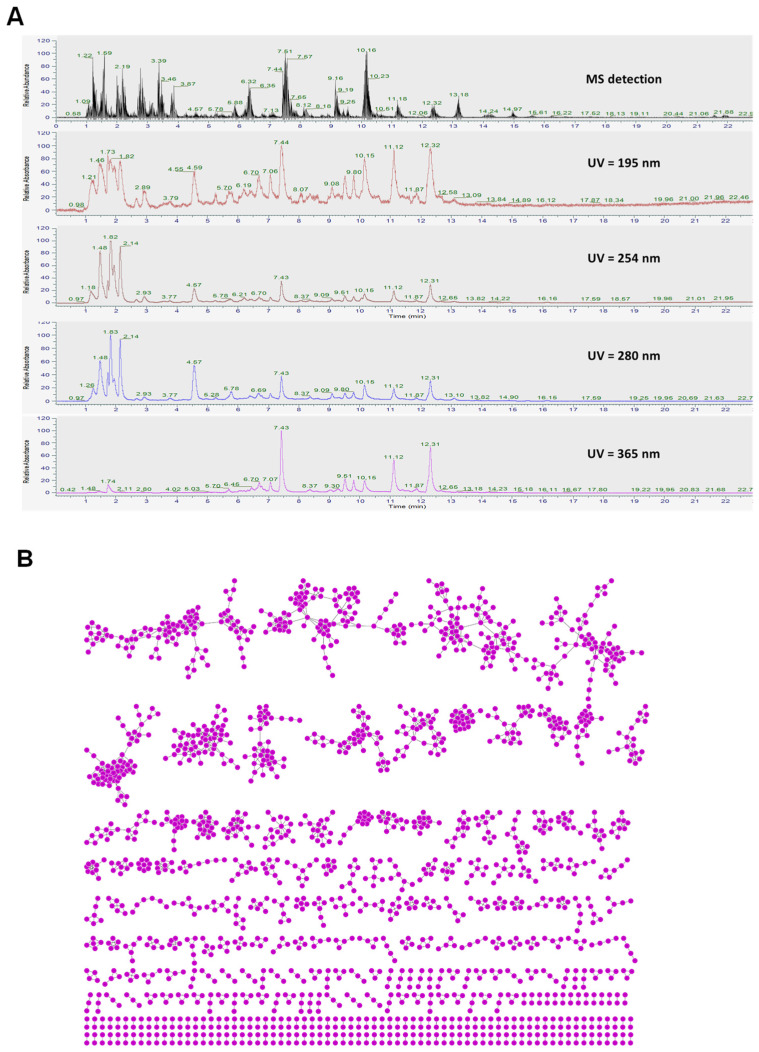
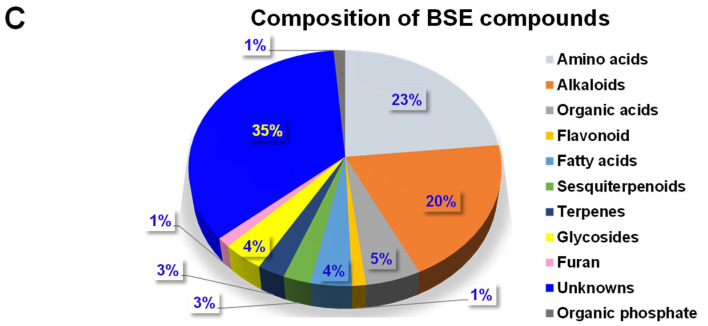
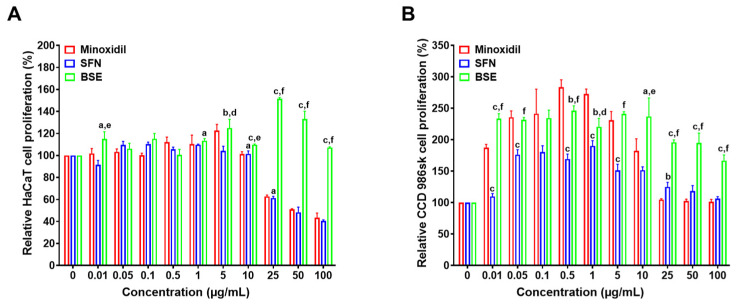
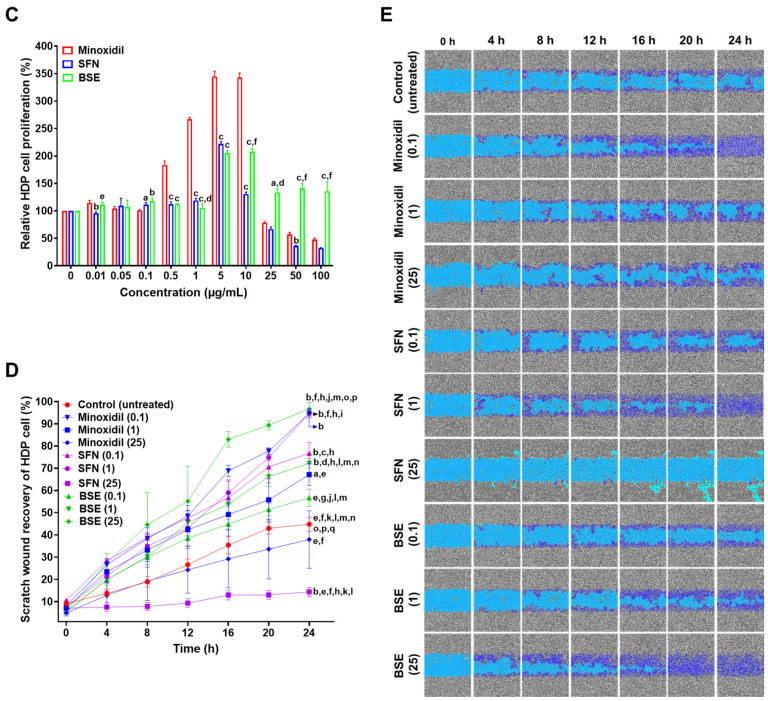
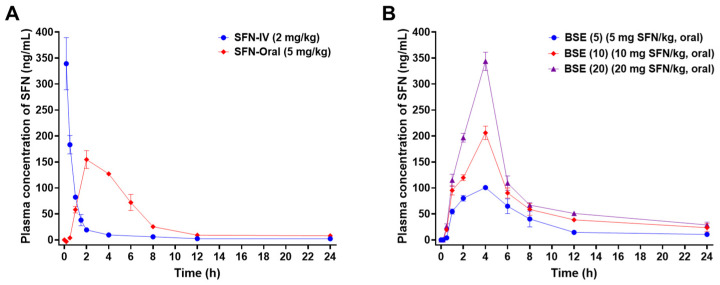
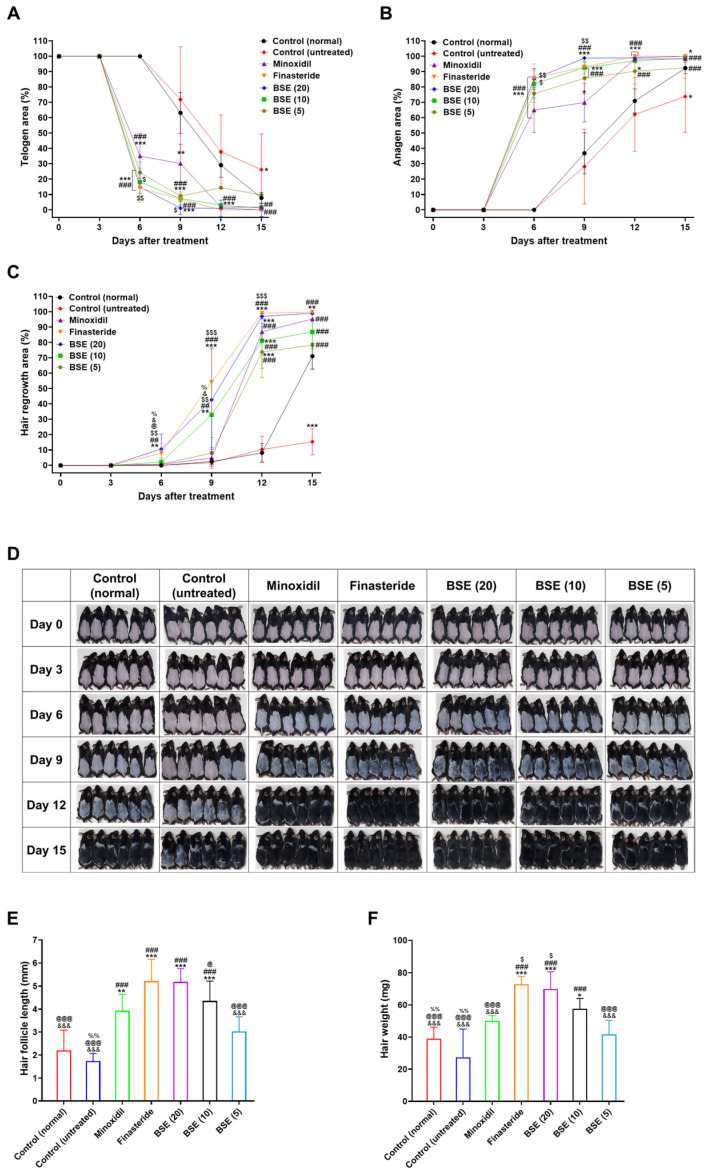
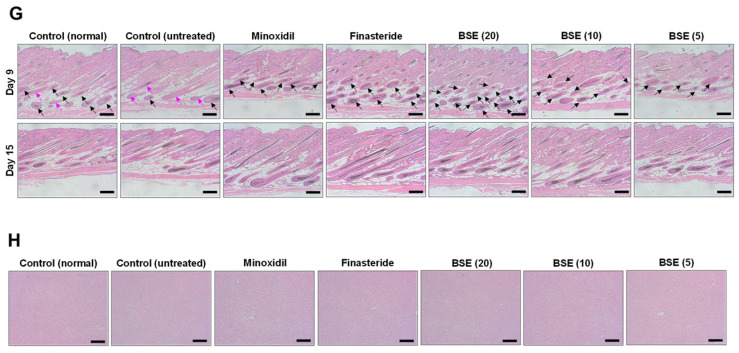
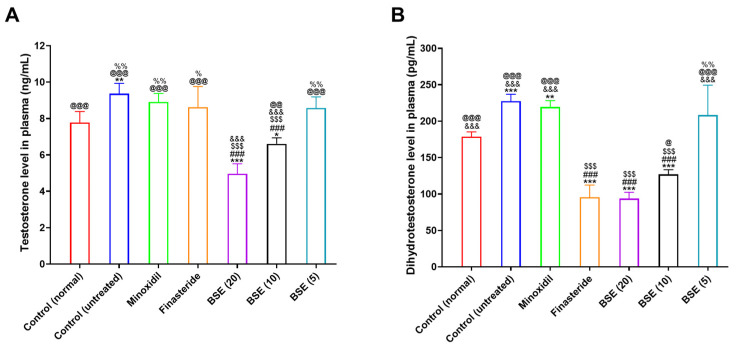
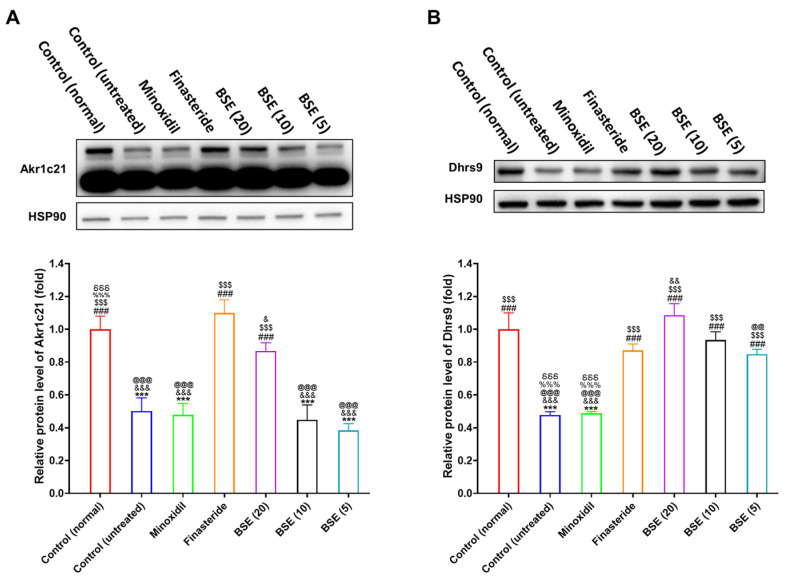
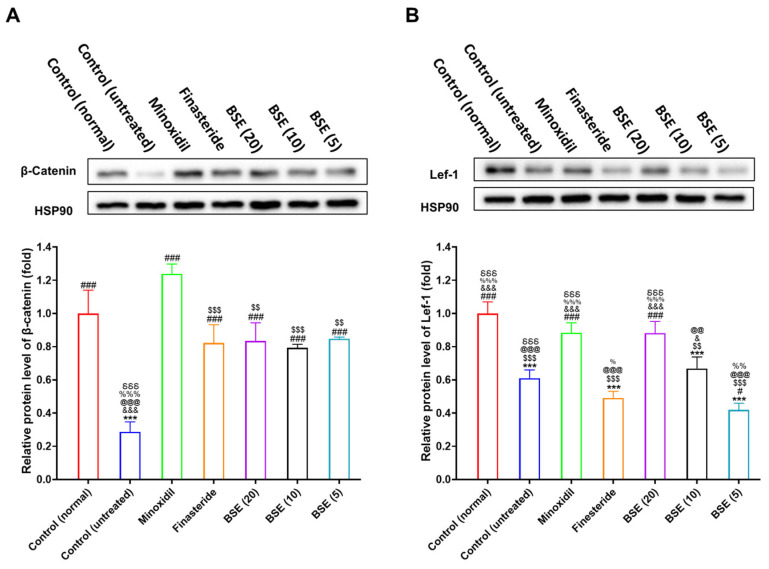
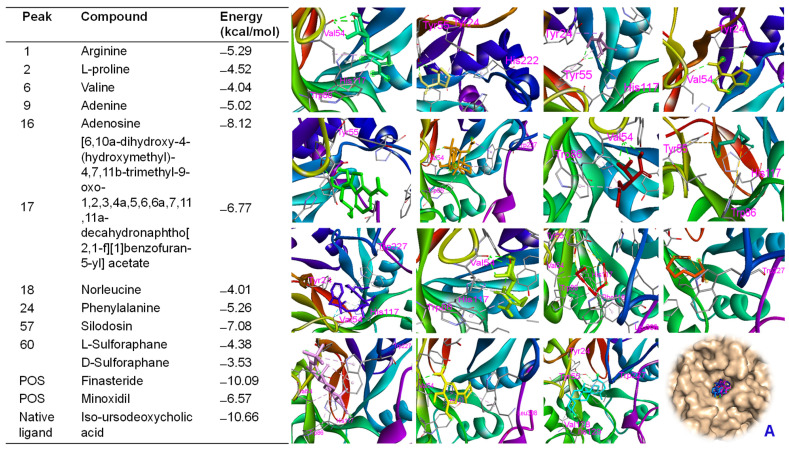
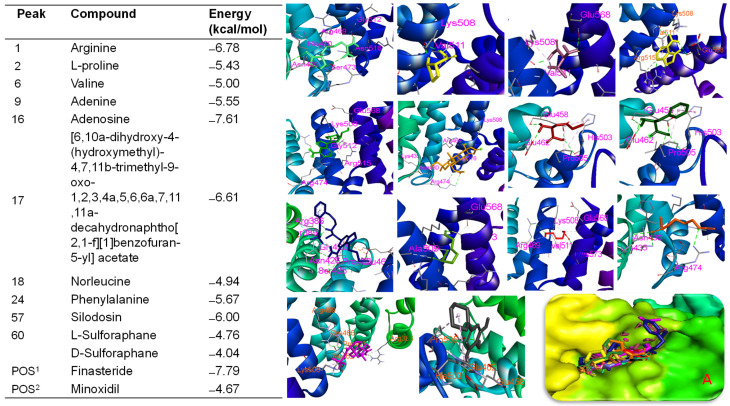
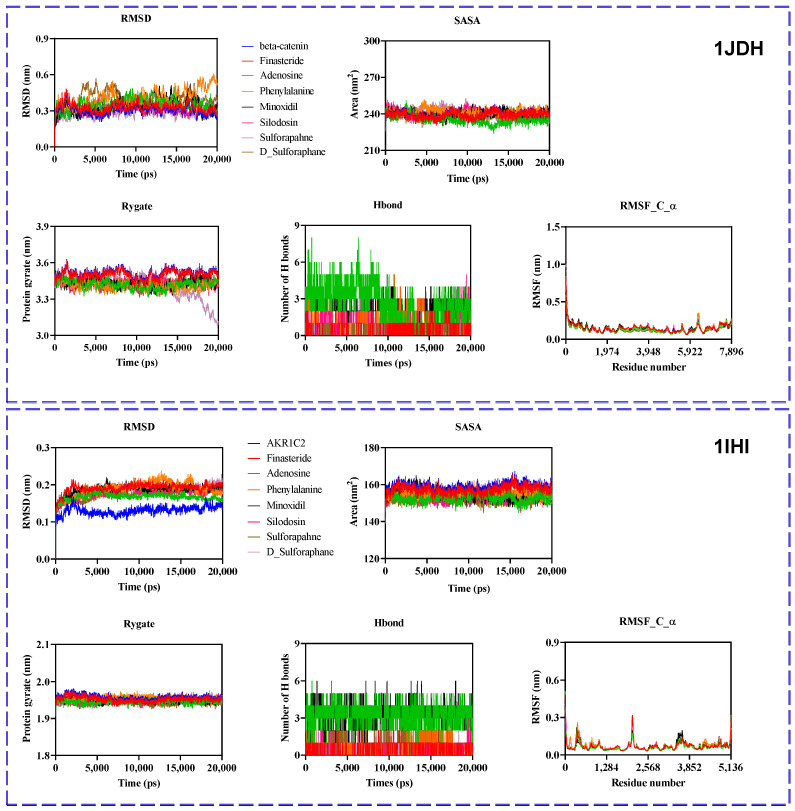
Androgenetic alopecia (AGA) is a common progressive hair loss disorder driven by elevated dihydrotestosterone (DHT) levels, leading to follicular miniaturization. This study investigated sulforaphane-rich broccoli sprout extract (BSE) as a potential oral therapy for AGA. BSE exhibited dose-dependent proliferative and migratory effects on keratinocytes, dermal fibroblasts, and dermal papilla cells, showing greater in vitro activity than sulforaphane (SFN) and minoxidil under the tested conditions, while maintaining low cytotoxicity. In a testosterone-induced AGA mouse model, oral BSE significantly accelerated hair regrowth, with 20 mg/kg achieving 99% recovery by day 15, alongside increased follicle length, density, and hair weight. Mechanistically, BSE upregulated hepatic and dermal DHT-metabolizing enzymes (Akr1c21, Dhrs9) and activated Wnt/β-catenin signaling in the skin, suggesting dual actions via androgen metabolism modulation and follicular regeneration. Pharmacokinetic analysis revealed prolonged SFN plasma exposure following BSE administration, and in silico docking showed strong binding affinities of key BSE constituents to Akr1c2 and β-catenin. No systemic toxicity was observed in liver histology. These findings indicate that BSE may serve as a safe, effective, and multitargeted natural therapy for AGA. Further clinical studies are needed to validate its efficacy in human populations.

Keywords: androgenetic alopecia; broccoli sprout extract; dihydrotestosterone; hair regeneration; hepatic DHT metabolism; sulforaphane.


Conflict of interest statement

Suk-Jung Oh was employed by the Research & Development, Ecoworld Pharm Co., Ltd. The remaining authors declare that the research was conducted in the absence of any commercial or financial relationships that could be construed as a potential conflict of interest.

Figures

Figure 1
Figure 1
(A) Chemical profile of broccoli sprout extract (BSE) detected using mass spectrometry (MS) and multiple ultraviolet (UV) wavelengths. (B) Feature-based molecular networking (FBMN) of BSE visualized using Cytoscape 3.10.1. (C) Chemical classification of compounds identified in BSE.
Figure 1
Figure 1
(A) Chemical profile of broccoli sprout extract (BSE) detected using mass spectrometry (MS) and multiple ultraviolet (UV) wavelengths. (B) Feature-based molecular networking (FBMN) of BSE visualized using Cytoscape 3.10.1. (C) Chemical classification of compounds identified in BSE.
Figure 2
Figure 2
In vitro cell proliferation assay. Relative cell proliferation of (A) HaCaT, (B) CCD 986sk, and (C) HDP cells after treatment with minoxidil, SFN, and BSE at various concentrations. a p < 0.05, b p < 0.01, and c p < 0.001 compared to minoxidil; d p < 0.05, e p < 0.01, and f p < 0.001 compared to SFN. Values are presented as mean ± SD (n = 3 for each group). (D) Time course curve of relative scratch wound recovery of HDP cells after incubation with various concentrations of minoxidil, SFN, and BSE. a p < 0.01 and b p < 0.001 compared to the control; c p < 0.05, d p < 0.01, and e p < 0.001 compared to minoxidil (0.1); f p < 0.001 compared to minoxidil (1); g p < 0.01 and h p < 0.001 compared to minoxidil (25); i p < 0.05, j p < 0.01, and k p < 0.001 compared to SFN (0.1); l p < 0.001 compared to SFN (1); m p < 0.001 compared to SFN (25); n p < 0.05 and o p < 0.001 compared to BSE (0.1); p p < 0.001 compared to BSE (1); q p < compared to BSE (25). Values are presented as mean ± SD (n = 3 for each group). (E) Representative microscope images of scratch wounds in HDP cells. Color code: gray—initial cell state; light sky blue—scratch wound area; bluish purple—wound recovery area.
Figure 2
Figure 2
In vitro cell proliferation assay. Relative cell proliferation of (A) HaCaT, (B) CCD 986sk, and (C) HDP cells after treatment with minoxidil, SFN, and BSE at various concentrations. a p < 0.05, b p < 0.01, and c p < 0.001 compared to minoxidil; d p < 0.05, e p < 0.01, and f p < 0.001 compared to SFN. Values are presented as mean ± SD (n = 3 for each group). (D) Time course curve of relative scratch wound recovery of HDP cells after incubation with various concentrations of minoxidil, SFN, and BSE. a p < 0.01 and b p < 0.001 compared to the control; c p < 0.05, d p < 0.01, and e p < 0.001 compared to minoxidil (0.1); f p < 0.001 compared to minoxidil (1); g p < 0.01 and h p < 0.001 compared to minoxidil (25); i p < 0.05, j p < 0.01, and k p < 0.001 compared to SFN (0.1); l p < 0.001 compared to SFN (1); m p < 0.001 compared to SFN (25); n p < 0.05 and o p < 0.001 compared to BSE (0.1); p p < 0.001 compared to BSE (1); q p < compared to BSE (25). Values are presented as mean ± SD (n = 3 for each group). (E) Representative microscope images of scratch wounds in HDP cells. Color code: gray—initial cell state; light sky blue—scratch wound area; bluish purple—wound recovery area.
Figure 3
Figure 3
In vivo pharmacokinetic study in rats. Venous plasma concentration of SFN following a single (A) IV injection (SFN-IV, 2 mg/kg) and oral administration (SFN-Oral, 5 mg/kg). (B) Plasma concentration of SFN after oral administration of BSE (5) (5 mg/kg equivalent to SFN), BSE (10) (10 mg/kg equivalent to SFN), and BSE (20) (20 mg/kg equivalent to SFN). Values are presented as mean ± SD (n = 3 for each group).
Figure 4
Figure 4
In vivo evaluation of hair regrowth efficacy in the following groups: control (normal) (non-androgenic model, no treatment), control (untreated) (androgenic model, no treatment), minoxidil (androgenic model, 1% minoxidil, topical application, once daily), finasteride (androgenic model, 1 mg/kg finasteride, oral administration, once daily), and broccoli sprout extract (BSE 20, 10, or 5) (androgenic model, BSE administered orally at doses of 20, 10, or 5 mg/kg, once daily). (A) Time course curve showing reduction in telogen phase (pink area). (B) Time course curve showing an increase in the anagen phase (black area), representing the transition from the telogen phase to the anagen phase on dorsal skin. (C) Time course curve showing hair regrowth on dorsal skin. * p < 0.05, ** p < 0.01, and *** p < 0.001 compared to control (normal); ## p < 0.01 and ### p < 0.001 compared to control (untreated); $ p < 0.05, $$ p < 0.01, and $$$ p < 0.001 compared to minoxidil; @ p < 0.05 compared to finasteride; & p < 0.05 compared to BSE (20); % p < 0.05 compared to BSE (10). Values are presented as mean ± SD (n = 6 for each group). (D) Representative photographs of mouse dorsal skin showing hair regrowth. (E) Length of hair follicles at 15 days after treatment. (F) Hair weight for each group on day 15 after treatment. * p < 0.05 and ** p < 0.01 compared to control (normal); ### p < 0.001 compared to control (untreated); $ p < 0.05 compared to minoxidil; @ p < 0.05 and @@@ p < 0.001 compared to finasteride; &&& p < 0.001 compared to BSE (20); %% p < 0.01 compared to BSE (10). Values are presented as mean ± SD (n = 6 for each group). (G) Hematoxylin and eosin (H&E) staining of mouse skin sections on days 9 and 15 post-treatment to observe hair regrowth trends. Scale bar = 100 µm. Pink arrow—telogen phase and black arrow—anagen phase. (H) Cross-sectional images of liver tissue stained with H&E to assess toxicity. Scale bar = 100 µm.
Figure 4
Figure 4
In vivo evaluation of hair regrowth efficacy in the following groups: control (normal) (non-androgenic model, no treatment), control (untreated) (androgenic model, no treatment), minoxidil (androgenic model, 1% minoxidil, topical application, once daily), finasteride (androgenic model, 1 mg/kg finasteride, oral administration, once daily), and broccoli sprout extract (BSE 20, 10, or 5) (androgenic model, BSE administered orally at doses of 20, 10, or 5 mg/kg, once daily). (A) Time course curve showing reduction in telogen phase (pink area). (B) Time course curve showing an increase in the anagen phase (black area), representing the transition from the telogen phase to the anagen phase on dorsal skin. (C) Time course curve showing hair regrowth on dorsal skin. * p < 0.05, ** p < 0.01, and *** p < 0.001 compared to control (normal); ## p < 0.01 and ### p < 0.001 compared to control (untreated); $ p < 0.05, $$ p < 0.01, and $$$ p < 0.001 compared to minoxidil; @ p < 0.05 compared to finasteride; & p < 0.05 compared to BSE (20); % p < 0.05 compared to BSE (10). Values are presented as mean ± SD (n = 6 for each group). (D) Representative photographs of mouse dorsal skin showing hair regrowth. (E) Length of hair follicles at 15 days after treatment. (F) Hair weight for each group on day 15 after treatment. * p < 0.05 and ** p < 0.01 compared to control (normal); ### p < 0.001 compared to control (untreated); $ p < 0.05 compared to minoxidil; @ p < 0.05 and @@@ p < 0.001 compared to finasteride; &&& p < 0.001 compared to BSE (20); %% p < 0.01 compared to BSE (10). Values are presented as mean ± SD (n = 6 for each group). (G) Hematoxylin and eosin (H&E) staining of mouse skin sections on days 9 and 15 post-treatment to observe hair regrowth trends. Scale bar = 100 µm. Pink arrow—telogen phase and black arrow—anagen phase. (H) Cross-sectional images of liver tissue stained with H&E to assess toxicity. Scale bar = 100 µm.
Figure 5
Figure 5
Plasma level of androgenic hormone related to hair growth. In vivo plasma levels of (A) testosterone and (B) dihydrotestosterone in control (normal) (non-androgenic model, no treatments), control (untreated) (androgenic model, no treatments), minoxidil (androgenic model, minoxidil (1%), topical application, once in a day), finasteride (androgenic model, finasteride 1 mg/kg, oral administration, once in a day), and broccoli sprout extract (BSE) (BSE 20, 10, or 5) (androgenic model, BSE with its equivalent dose of 20, 10, or 5 mg/kg, oral administration, once in a day). * p < 0.05, ** p < 0.01, and *** p < 0.001 compared to control (normal); ### p < 0.001 compared to control (untreated); $$$ p < 0.001 compared to minoxidil; &&& p < 0.001 compared to finasteride; @ p < 0.05, @@ p < 0.01, and @@@ p < 0.001 compared to BSE (20); % p < 0.05 and %% p < 0.01 compared to BSE (10). Values are presented as mean ± SD (n = 6 for each group).
Figure 6
Figure 6
In vivo activation of 3α-HSD enzymes in the liver 15 days post-treatment. Relative protein expression levels of (A) Akr1c21 and (B) Dhrs9 in liver tissues were quantified from Western blot band intensities. Bar graphs represent quantification of band intensities normalized to HSP90. *** p < 0.001 compared to control (normal) (non-androgenic model, no treatments); ### p < 0.001 compared to control (untreated) (androgenic model, no treatments); $$$ p < 0.001 compared to minoxidil (androgenic model, minoxidil (1%), topical application, once in a day); & p < 0.05, && p < 0.01, and &&& p < 0.001 compared to finasteride (androgenic model, finasteride 1 mg/kg, oral administration, once in a day); @@ p < 0.01 and @@@ p < 0.001 compared to BSE (20) (androgenic model, BSE with its equivalent dose of 20 mg/kg, oral administration, once in a day); %%% p < 0.001 compared to BSE (10) (androgenic model, BSE with its equivalent dose of 10 mg/kg, oral administration, once in a day); δδδ p < 0.001 compared to BSE (5) (androgenic model, BSE with its equivalent dose of 5 mg/kg, oral administration, once in a day). Values are presented as mean ± SD (n = 3 for each group).
Figure 7
Figure 7
In vivo β-catenin levels in the dorsal skin of mice at 15 days post-treatment. Relative protein levels of (A) β-catenin and (B) Lef-1 in the dorsal skin of mice were quantified from Western blot band intensities. Bar graphs represent quantification of band intensities normalized to HSP90. *** p < 0.001 compared to control (normal) (non-androgenic model, no treatments); # p < 0.05 and ### p < 0.001 compared to control (untreated) (androgenic model, no treatments); $$ p < 0.01 and $$$ p < 0.001 compared to minoxidil (androgenic model, minoxidil (1%), topical application, once in a day); & p < 0.05 and &&& p < 0.001 compared to finasteride (androgenic model, finasteride 1 mg/kg, oral administration, once in a day); @@ p < 0.01 and @@@ p < 0.001 compared to BSE (20) (androgenic model, BSE with its equivalent dose of 20 mg/kg, oral administration, once in a day); % p < 0.05, %% p < 0.01, and %%% p < 0.001 compared to BSE (10) (androgenic model, BSE with its equivalent dose of 10 mg/kg, oral administration, once in a day); δδδ p < 0.001 compared to BSE (5) (androgenic model, BSE with its equivalent dose of 5 mg/kg, oral administration, once in a day). Values are presented as mean ± SD (n = 3 for each group).
Figure 8
Figure 8
Binding affinities and interactions of major compounds—arginine (light green), L-proline (light yellow), valine (dark pink), adenine (limon), adenosine (green), [6,10a-dihydroxy-4-(hydroxymethyl)-4,7,11b-trimethyl-9-oxo-1,2,3,4a,5,6,6a,7,11,11a-decahydronaphtho[2,1-f][1]benzofuran-5-yl] acetate (light orange), norleucine (dark red), phenylalanine (dark green), silodosin (violet), L-sulforaphane (waxy green), D-sulforaphane (red), finasteride (magenta), minoxidil (yellow), and the native ligand (iso-ursodeoxycholic acid, marine)—with amino acid residues when docked into the Ark1c2 protein (PDB ID: 1IHI). A: All compounds were docked into the active region of the protein.
Figure 9
Figure 9
Binding affinities and interactions of major compounds—arginine (light green), L-proline (light yellow), valine (dark pink), adenine (yellow), adenosine (green), [6,10a-dihydroxy-4-(hydroxymethyl)-4,7,11b-trimethyl-9-oxo-1,2,3,4a,5,6,6a,7,11,11a-decahydronaphtho[2,1-f][1]benzofuran-5-yl] acetate (light orange), norleucine (dark red), phenylalanine (dark green), silodosin (violet), L-sulforaphane (waxy green), D-sulforaphane (orange), finasteride (magenta), and minoxidil (black)—with amino acid residues when docked into the β-catenin protein (PDB ID: 1JDH). A: All compounds were docked into the active region of the protein.
Figure 10
Figure 10
Molecular dynamic simulation analyses of protein–ligand complexes for 1JDH: β-catenin and transcription factor 4 (Tcf4) (top panel); 1IHI: AKR1C2 with NADP+ and ursodeoxycholate (bottom panel). Each panel corresponds to a target protein, with multiple ligands—including finasteride, adenosine, phenylalanine, minoxidil, silodosin, 1a46_trimethyl, L-sulforaphane, and D-sulforaphane—assessed for their interaction profiles during the simulation.

Similar articles

References

    1. Islam N., Leung P.S., Huntley A.C., Gershwin M.E. The autoimmune basis of alopecia areata: A comprehensive review. Autoimmun. Rev. 2015;14:81–89. doi: 10.1016/j.autrev.2014.10.014. - DOI - PubMed
    1. Dhami L. Psychology of Hair Loss Patients and Importance of Counseling. Indian J. Plast. Surg. 2021;54:411–415. doi: 10.1055/s-0041-1741037. - DOI - PMC - PubMed
    1. Aukerman E.L., Jafferany M. The psychological consequences of androgenetic alopecia: A systematic review. J. Cosmet. Dermatol. 2023;22:89–95. doi: 10.1111/jocd.14983. - DOI - PMC - PubMed
    1. Pozo-Pérez L., Tornero-Esteban P., López-Bran E. Clinical and preclinical approach in AGA treatment: A review of current and new therapies in the regenerative field. Stem Cell Res. Ther. 2024;15:260. doi: 10.1186/s13287-024-03801-5. - DOI - PMC - PubMed
    1. Ntshingila S., Oputu O., Arowolo A.T., Khumalo N.P. Androgenetic alopecia: An update. JAAD Int. 2023;13:150–158. doi: 10.1016/j.jdin.2023.07.005. - DOI - PMC - PubMed

MeSH terms

LinkOut - more resources