. 2025 Aug 1;26(15):7465.
doi: 10.3390/ijms26157465.

Loss of SVIP Results in Metabolic Reprograming and Increased Retention of Very-Low-Density Lipoproteins in Hepatocytes

Affiliations

Loss of SVIP Results in Metabolic Reprograming and Increased Retention of Very-Low-Density Lipoproteins in Hepatocytes

Vandana Sekhar et al. Int J Mol Sci. .

Abstract

Perturbations in the tightly regulated processes of VLDL biosynthesis and secretion can directly impact both liver and cardiovascular health. Patients with metabolic disorders have an increased risk of developing hepatic steatosis, which can lead to cirrhosis. These associated metabolic risks underscore the importance of discerning the role of different cellular proteins involved in VLDL biogenesis, transport, and secretion. Small VCP-Interacting Protein (SVIP) has been identified as a component of VLDL transport vesicles and VLDL secretion. This study evaluates the cellular effects stemming from the CRISPR-Cas9-mediated depletion of SVIP in rat hepatocytes. The SVIP-knockout (KO) cells display an increased VLDL retention with elevated intracellular levels of ApoB100 and neutral lipid staining. RNA sequencing studies reveal an impaired PPARα and Nrf2 signaling in the SVIP KO cells, implying a state of metabolic reprograming, with a shift from fatty acid uptake, synthesis, and oxidation to cells favoring the activation of glucose by impaired glycogen storage and increased glucose release. Additionally, SVIP KO cells exhibit a transcriptional profile indicative of acute phase response (APR) in hepatocytes. Many inflammatory markers and genes associated with APR are upregulated in the SVIP KO hepatocytes. In accordance with an APR-like response, the cells also demonstrate an increase in mRNA expression of genes associated with protein synthesis. Together, our data demonstrate that SVIP is critical in maintaining hepatic lipid homeostasis and metabolic balance by regulating key pathways such as PPARα, Nrf2, and APR.

Keywords: PPARs; SVIP; VLDL secretion; dyslipidemia; lipids; triglyceride.


Conflict of interest statement

The authors declare that they have no known competing financial interests or personal relationships that could have appeared to influence the work reported in this paper.

Figures

Figure 1
Figure 1
CRISPR-Cas9-mediated mutagenesis results in generation of SVIP-knockout rat hepatoma cell line. (A) Schematic diagram showing the region of the rat SVIP gene that was targeted for the CRISPR mutagenesis study. Two guide RNAs (sgRNA1 and sgRNA2) targeting the region around exon 1, including the promoter region, the CpG island, and parts of intron 1 in the wildtype cells, are shown. The CRISPR-Cas9-mediated mutagenesis resulted in a deletion of 895 bp with the majority of exon 1 deleted. (B) Western blot image confirming the complete loss of the SVIP protein in the SVIP KO cells compared to wildtype (WT) cells. β-actin was used as a loading control. (C) Relative expression levels of the SVIP and the β-actin proteins in the wildtype and SVIP KO cells. The data are representative of mean ± SD of three independent experiments. (**** p <0.0001, using unpaired t-test, ns= not significant).
Figure 1
Figure 1
CRISPR-Cas9-mediated mutagenesis results in generation of SVIP-knockout rat hepatoma cell line. (A) Schematic diagram showing the region of the rat SVIP gene that was targeted for the CRISPR mutagenesis study. Two guide RNAs (sgRNA1 and sgRNA2) targeting the region around exon 1, including the promoter region, the CpG island, and parts of intron 1 in the wildtype cells, are shown. The CRISPR-Cas9-mediated mutagenesis resulted in a deletion of 895 bp with the majority of exon 1 deleted. (B) Western blot image confirming the complete loss of the SVIP protein in the SVIP KO cells compared to wildtype (WT) cells. β-actin was used as a loading control. (C) Relative expression levels of the SVIP and the β-actin proteins in the wildtype and SVIP KO cells. The data are representative of mean ± SD of three independent experiments. (**** p <0.0001, using unpaired t-test, ns= not significant).
Figure 2
Figure 2
The SVIP KO cells exhibit an increased retention of VLDL compared to wildtype cells. (A) Increased expression of the ApoB100 and the ApoB48 proteins was detected in the SVIP KO cells using Western blot analysis. β-actin was used as a loading control. (B) Relative levels of expression of the ApoB100, ApoB48, and β-actin proteins in the wildtype and SVIP KO cells. The data are representative of mean ± SD of three independent experiments. (** p = 0.0028 for ApoB100, ** p = 0.0062 for ApoB48, and ns = not significant, using 2-way ANOVA). (C) Confocal images showing intracellular neutral lipid staining using the BODIPY 493/503 stain in the wildtype and the SVIP KO cells. The BODIPY 493/503 staining is shown in green, and the DAPI-stained nuclei are shown in blue. Images were taken using a 63x objective. Scale bar = 10 µm. (D) Quantification of the number of green spots (FITC signal) observed in wildtype and SVIP KO cells (**** p  <  0.0001, using unpaired t-test). (E) Quantification data showing relative levels of VLDL secretion from cells. Wildtype and SVIP KO cells were washed with warm (37 °C) PBS and incubated with [3H]-oleic acid complexed with BSA at a final concentration of 0.4 mM oleic acid for 1 h. Post incubation, medium containing oleic acid–BSA was removed and replaced with fresh medium without oleic acid–BSA complex. A total of 200 µL of medium was collected at different time points, and the resulting associated [3H]-TAG dpm was measured using scintillation counter. Error bars represent mean ± S.D. (n = 3), (* p = 0.0411, ** p = 0.0085 for 6 h, ** p = 0.0070 for 24 h, and ns = not significant, using 2-way ANOVA).
Figure 2
Figure 2
The SVIP KO cells exhibit an increased retention of VLDL compared to wildtype cells. (A) Increased expression of the ApoB100 and the ApoB48 proteins was detected in the SVIP KO cells using Western blot analysis. β-actin was used as a loading control. (B) Relative levels of expression of the ApoB100, ApoB48, and β-actin proteins in the wildtype and SVIP KO cells. The data are representative of mean ± SD of three independent experiments. (** p = 0.0028 for ApoB100, ** p = 0.0062 for ApoB48, and ns = not significant, using 2-way ANOVA). (C) Confocal images showing intracellular neutral lipid staining using the BODIPY 493/503 stain in the wildtype and the SVIP KO cells. The BODIPY 493/503 staining is shown in green, and the DAPI-stained nuclei are shown in blue. Images were taken using a 63x objective. Scale bar = 10 µm. (D) Quantification of the number of green spots (FITC signal) observed in wildtype and SVIP KO cells (**** p  <  0.0001, using unpaired t-test). (E) Quantification data showing relative levels of VLDL secretion from cells. Wildtype and SVIP KO cells were washed with warm (37 °C) PBS and incubated with [3H]-oleic acid complexed with BSA at a final concentration of 0.4 mM oleic acid for 1 h. Post incubation, medium containing oleic acid–BSA was removed and replaced with fresh medium without oleic acid–BSA complex. A total of 200 µL of medium was collected at different time points, and the resulting associated [3H]-TAG dpm was measured using scintillation counter. Error bars represent mean ± S.D. (n = 3), (* p = 0.0411, ** p = 0.0085 for 6 h, ** p = 0.0070 for 24 h, and ns = not significant, using 2-way ANOVA).
Figure 3
Figure 3
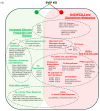
Summary of transcriptional changes in response to SVIP KO hepatocellular carcinoma cells. (A) Upregulated genes are represented in green and downregulated genes in red. Major shifts affecting fatty acid synthesis and other pathways are highlighted by dashed-line ovals. For example, loss of SVIP expression results in a shift from FA uptake, activation, synthesis, and oxidation, suggesting impaired PPARα signaling. Simultaneously, the cells favor the activation of glucose (impaired glycogen storage and increased glucose release). The SVIP KO cells show a transcriptional profile reminiscent of acute phase response (APR) of hepatocytes, with a set of genes characteristic for APR being upregulated, while genes that are downregulated during APR are also downregulated in SVIP KO cells. In line with an APR-like response, the cells have increased mRNA expression of genes associated with protein synthesis. These mRNA expression changes indicative of metabolic reprograming include the suppression of Nrf2 target genes and glutathione metabolism. (B) Gene expression analysis and heatmap visualization. Differential expression analysis was performed on gene expression data from knockout (KO1, KO2) and wildtype control (WT1, WT2) samples. For each gene, the log2 fold change (log2FC) was calculated as: log2(KO mean WT mean) log2(WT mean KO mean). Genes with an absolute log2FC greater than log2(1.5) ≈ 0.585 were considered biologically relevant. Statistical significance was assessed using a two-sample t-test, followed by the Benjamini–Hochberg correction to control the false discovery rate (FDR), with a threshold of FDR < 0.05. For visualization, a heatmap of z-score-normalized expression values was generated. Genes included in the heatmap fell into three categories: (1) custom list of 14 user-specified genes; (2) the top 10 differentially expressed genes, selected based on lowest FDR among those with |log2FC| > 0.585; and (3) additional genes meeting the following criteria: FDR < 0.01, |log2FC| > 2 (corresponding to ≥4-fold change). Mean expression > 10. Sample labels were reordered to display controls (WT1, WT2) on the left and KOs (KO1, KO2) on the right. Gene rows were hierarchically clustered to highlight co-regulated expression patterns. (C) Western blot image confirming a significant reduction in the LC3B and ATG-5 protein levels in the SVIP KO cells compared to wildtype (WT) cells. β-actin was used as a loading control. (D) Relative expression levels of the LC3B, ATG-5, and the β-actin proteins in the wildtype and SVIP KO cells. The data are representative of mean ± SD of two independent experiments. (*** p = 0.001, ** p = 0.004 using 2-way ANOVA, ns = not significant).
Figure 3
Figure 3
Summary of transcriptional changes in response to SVIP KO hepatocellular carcinoma cells. (A) Upregulated genes are represented in green and downregulated genes in red. Major shifts affecting fatty acid synthesis and other pathways are highlighted by dashed-line ovals. For example, loss of SVIP expression results in a shift from FA uptake, activation, synthesis, and oxidation, suggesting impaired PPARα signaling. Simultaneously, the cells favor the activation of glucose (impaired glycogen storage and increased glucose release). The SVIP KO cells show a transcriptional profile reminiscent of acute phase response (APR) of hepatocytes, with a set of genes characteristic for APR being upregulated, while genes that are downregulated during APR are also downregulated in SVIP KO cells. In line with an APR-like response, the cells have increased mRNA expression of genes associated with protein synthesis. These mRNA expression changes indicative of metabolic reprograming include the suppression of Nrf2 target genes and glutathione metabolism. (B) Gene expression analysis and heatmap visualization. Differential expression analysis was performed on gene expression data from knockout (KO1, KO2) and wildtype control (WT1, WT2) samples. For each gene, the log2 fold change (log2FC) was calculated as: log2(KO mean WT mean) log2(WT mean KO mean). Genes with an absolute log2FC greater than log2(1.5) ≈ 0.585 were considered biologically relevant. Statistical significance was assessed using a two-sample t-test, followed by the Benjamini–Hochberg correction to control the false discovery rate (FDR), with a threshold of FDR < 0.05. For visualization, a heatmap of z-score-normalized expression values was generated. Genes included in the heatmap fell into three categories: (1) custom list of 14 user-specified genes; (2) the top 10 differentially expressed genes, selected based on lowest FDR among those with |log2FC| > 0.585; and (3) additional genes meeting the following criteria: FDR < 0.01, |log2FC| > 2 (corresponding to ≥4-fold change). Mean expression > 10. Sample labels were reordered to display controls (WT1, WT2) on the left and KOs (KO1, KO2) on the right. Gene rows were hierarchically clustered to highlight co-regulated expression patterns. (C) Western blot image confirming a significant reduction in the LC3B and ATG-5 protein levels in the SVIP KO cells compared to wildtype (WT) cells. β-actin was used as a loading control. (D) Relative expression levels of the LC3B, ATG-5, and the β-actin proteins in the wildtype and SVIP KO cells. The data are representative of mean ± SD of two independent experiments. (*** p = 0.001, ** p = 0.004 using 2-way ANOVA, ns = not significant).
Figure 4
Figure 4
SVIP KO significantly reduces the intracellular levels of L-FABP. (A) RT-qPCR assay depicting relative levels of L-FABP mRNA in SVIP KO cells. The data are representative of mean ± SD of three independent experiments. (**** p < 0.0001, using unpaired t-test). (B) Western blot image confirming a significant reduction in the L-FABP protein levels in the SVIP-KO cells compared to wildtype (WT) cells. β-actin was used as a loading control. (C) Relative expression levels of the L-FABP and β-actin proteins in the wildtype and SVIP KO cells. The data are representative of mean ± SD of three independent experiments. (*** p = 0.0006, using 2-way ANOVA, ns = not significant).

Similar articles

References

    1. Olié V., Gabet A., Grave C., Helft G., Fosse-Edorh S., Piffaretti C., Lailler G., Verdot C., Deschamps V., Vay-Demouy J., et al. Epidemiology of cardiovascular risk factors: Non-behavioural risk factors. Arch. Cardiovasc. Dis. 2024;117:761–769. doi: 10.1016/j.acvd.2024.08.005. - DOI - PubMed
    1. van Zwol W., van de Sluis B., Ginsberg H.N., Kuivenhoven J.A. VLDL Biogenesis and Secretion: It Takes a Village. Circ. Res. 2024;134:226–244. doi: 10.1161/CIRCRESAHA.123.323284. - DOI - PMC - PubMed
    1. Shelness G.S., Ingram M.F., Huang X.F., DeLozier J.A. Apolipoprotein B in the rough endoplasmic reticulum: Translation, translocation and the initiation of lipoprotein assembly. J. Nutr. 1999;129((Suppl. S2)):456S–462S. doi: 10.1093/jn/129.2.456S. - DOI - PubMed
    1. Siddiqi S.A. VLDL exits from the endoplasmic reticulum in a specialized vesicle, the VLDL transport vesicle, in rat primary hepatocytes. Biochem. J. 2008;413:333–342. doi: 10.1042/BJ20071469. - DOI - PubMed
    1. Barlowe C. COPII: A membrane coat formed by Sec proteins that drive vesicle budding from the endoplasmic reticulum. Cell. 1994;77:895–907. doi: 10.1016/0092-8674(94)90138-4. - DOI - PubMed

LinkOut - more resources