The Effect of Ketamine on the Immune System in Patients with Treatment-Resistant Depression
- PMID: 40806626
- PMCID: PMC12347219
- DOI: 10.3390/ijms26157500
The Effect of Ketamine on the Immune System in Patients with Treatment-Resistant Depression
Abstract
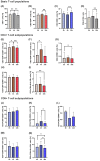
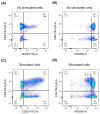
Treatment-resistant depression (TRD) is associated with immune dysregulation. Ketamine, a rapid-acting antidepressant, may exert effects via immunomodulation. The aim was to examine ketamine's impact on immune markers in TRD, including T-cell subsets, cytokines, and in vitro T-cell responses. Eighteen TRD inpatients received 0.5 mg/kg iv ketamine. Blood was sampled at baseline, 4 h, and 24 h to analyze T-cell phenotypes (CD28, CD69, CD25, CD95, HLA-DR) and serum cytokines (IL-6, IL-8, IL-10, TNF-α, IL-1β, IL-12p70). In vitro, PBMCs from TRD patients and controls were exposed to low (185 ng/mL) and high (300 ng/mL) ketamine doses. Ketamine induced a transient increase in total T cells and CD4+CD25+ and CD4+CD28+ subsets at 4 h, followed by a reduction in CD4+ and an increase in CD8+ T cells at 24 h, decreasing the CD4+/CD8+ ratio. Activation markers (CD4+CD69+, CD4+HLA-DR+, CD8+CD25+, CD8+HLA-DR+) declined at 24 h. Serum IL-10 increased, IL-6 decreased, and IL-8 levels-initially elevated-showed a sustained reduction. In vitro, high-dose ketamine enhanced the proliferation of TRD CD4+ T cells and dose-dependent IL-8 and IL-6 secretion from activated cells. Ketamine induces rapid, transient immune changes in TRD, including reduced T-cell activation and cytokine modulation. A sustained IL-8 decrease suggests anti-inflammatory effects and potential as a treatment-response biomarker.
Keywords: IL-8; T cells; cytokines; inflammation; ketamine; treatment-resistant depression.
Conflict of interest statement
The authors declare no conflict of interest.
Figures


Similar articles
-
Antidepressant Effect of Ketamine on Inflammation-Mediated Cytokine Dysregulation in Adults with Treatment-Resistant Depression: Rapid Systematic Review.Oxid Med Cell Longev. 2022 Sep 16;2022:1061274. doi: 10.1155/2022/1061274. eCollection 2022. Oxid Med Cell Longev. 2022. PMID: 36160713 Free PMC article.
-
Lack of relationships between ketamine treatment and peripheral neurotrophic and inflammatory factors in a randomized controlled ketamine trial of major depressive disorder.Brain Behav Immun. 2025 Aug;128:170-178. doi: 10.1016/j.bbi.2025.04.006. Epub 2025 Apr 4. Brain Behav Immun. 2025. PMID: 40188855 Clinical Trial.
-
Ketamine's Influence on Magnetoencephalography Patterns During a Working Memory Task in Treatment-Resistant Depression: An Exploratory Study.Bipolar Disord. 2025 Jun;27(4):316-322. doi: 10.1111/bdi.70027. Epub 2025 Apr 2. Bipolar Disord. 2025. PMID: 40176400 Clinical Trial.
-
Inflammatory cytokines, cortisol, and anhedonia in patients with treatment-resistant depression after consecutive infusions of low-dose esketamine.Eur Arch Psychiatry Clin Neurosci. 2025 Aug;275(5):1383-1390. doi: 10.1007/s00406-024-01913-w. Epub 2024 Sep 28. Eur Arch Psychiatry Clin Neurosci. 2025. PMID: 39340637
-
Ketamine administration in depressive disorders: a systematic review and meta-analysis.Psychopharmacology (Berl). 2014 Sep;231(18):3663-76. doi: 10.1007/s00213-014-3664-5. Epub 2014 Jul 20. Psychopharmacology (Berl). 2014. PMID: 25038867
References
-
- Caraci F., Calabrese F., Molteni R., Bartova L., Dold M., Leggio G.M., Fabbri C., Mendlewicz J., Racagni G., Kasper S., et al. International Union of Basic and Clinical Pharmacology CIV: The Neurobiology of Treatment-resistant Depression: From Antidepressant Classifications to Novel Pharmacological Targets. Pharmacol. Rev. 2018;70:475–504. doi: 10.1124/pr.117.014977. - DOI - PubMed
-
- McIntyre R.S., Alsuwaidan M., Baune B.T., Berk M., Demyttenaere K., Goldberg J.F., Gorwood P., Ho R., Kasper S., Kennedy S.H., et al. Treatment-resistant depression: Definition, prevalence, detection, management, and investigational interventions. World Psychiatry. 2023;22:394–412. doi: 10.1002/wps.21120. - DOI - PMC - PubMed
MeSH terms
Substances
Grants and funding
LinkOut - more resources
Full Text Sources
Medical
Research Materials

