. 2025 Aug 4;26(15):7523.
doi: 10.3390/ijms26157523.

Breast Cancer Cell Line-Specific Responses to Insulin: Effects on Proliferation and Migration

Affiliations

Breast Cancer Cell Line-Specific Responses to Insulin: Effects on Proliferation and Migration

Mattia Melloni et al. Int J Mol Sci. .

Abstract

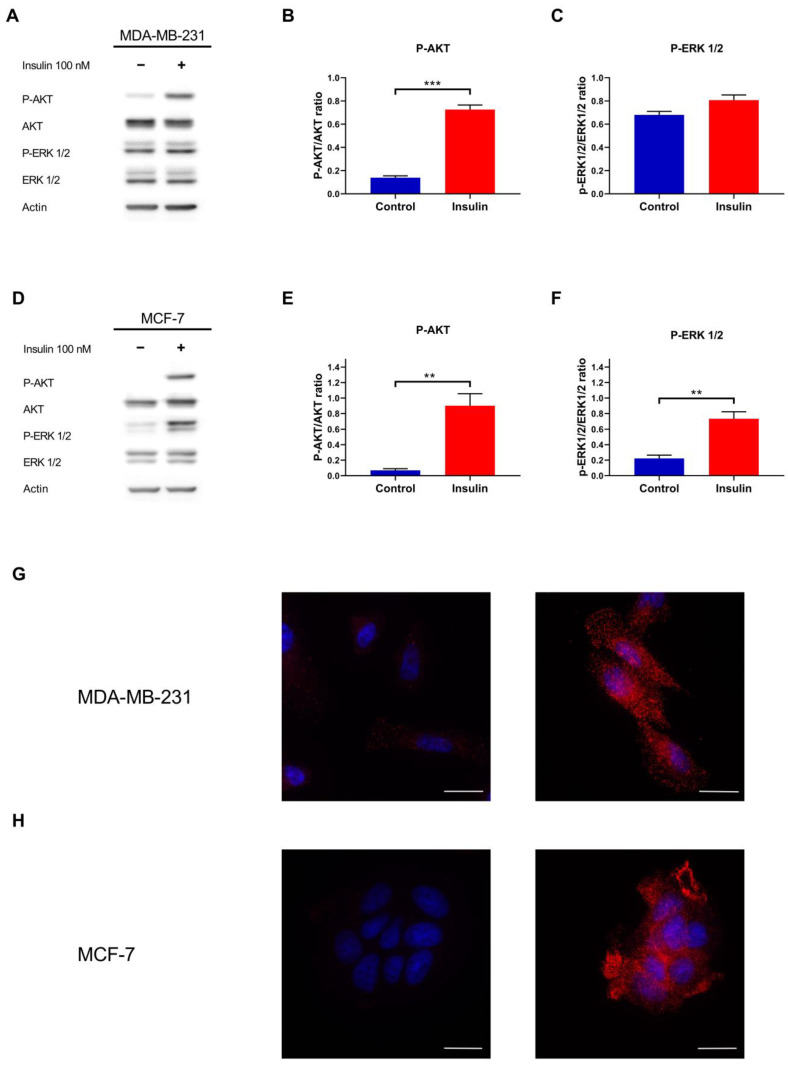
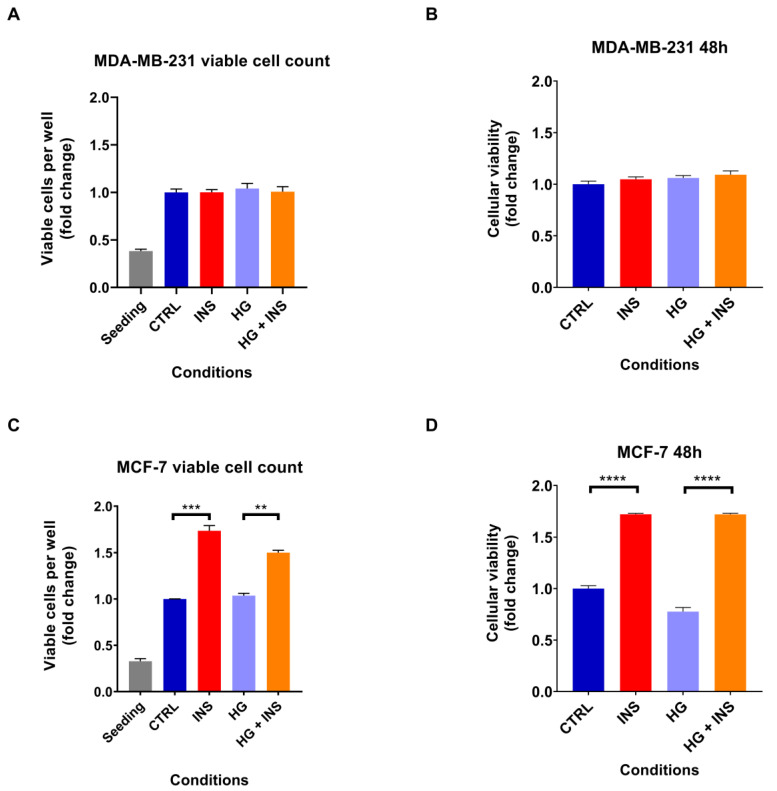
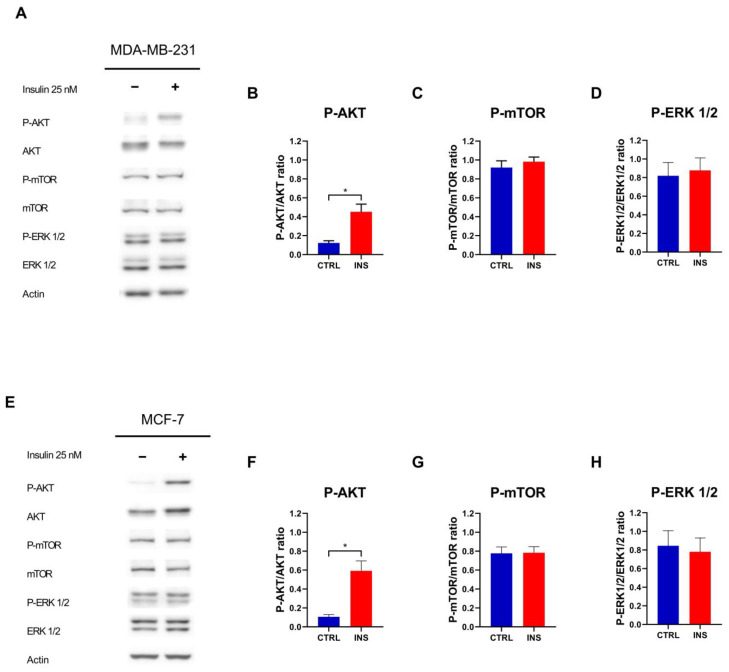
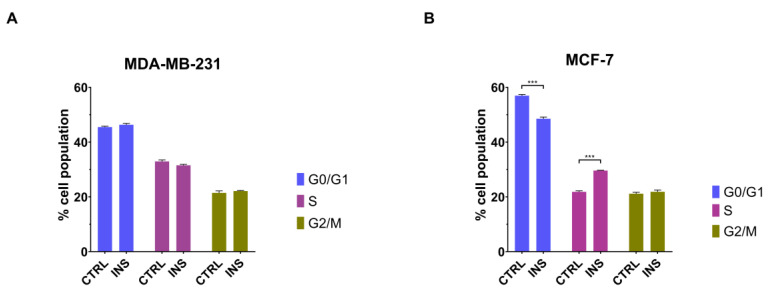
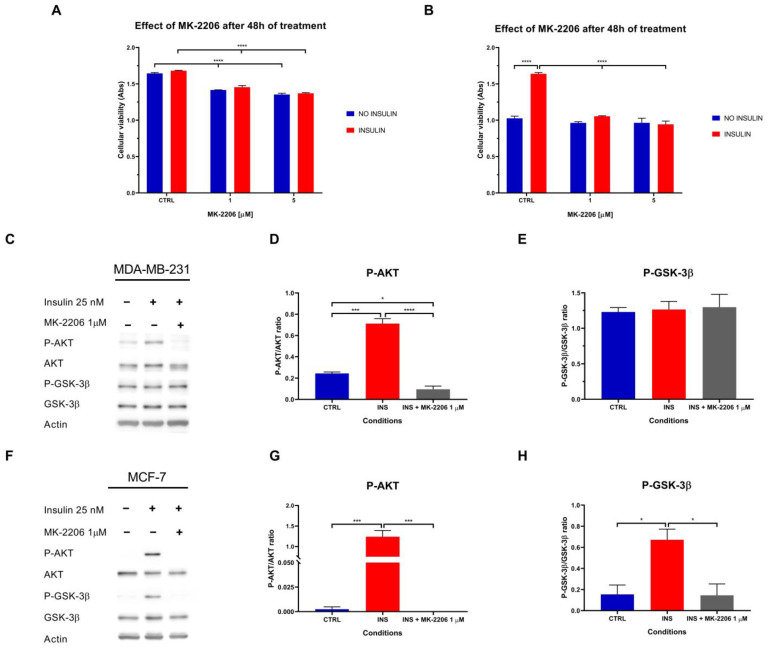
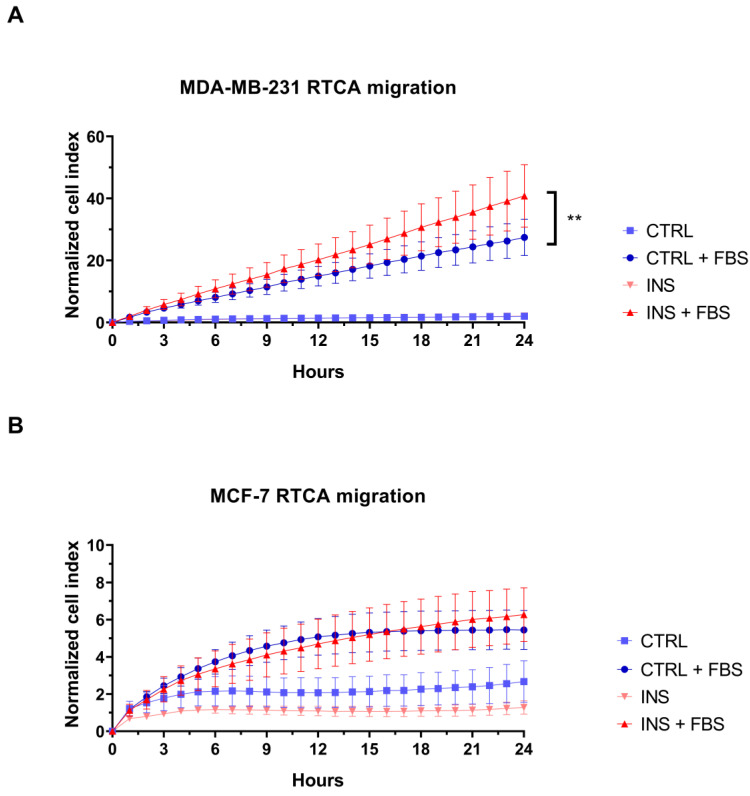
Breast cancer (BC) progression appears to be significantly influenced by the diabetic microenvironment, characterised by hyperglycaemia and hyperinsulinemia, though the exact cellular mechanisms remain partly unclear. This study investigated the effects of exposure to supra-physiological levels of glucose and insulin on two distinct BC cell models: hormone-responsive MCF-7 cells and triple-negative MDA-MB-231 cells. To evaluate the effects triggered by high insulin level in different BC cell subtypes, we analysed the activation status of PI3K/AKT and MAPK pathways, cell proliferation, cell distribution in cell cycle phases and cell migration. High insulin level significantly activates the insulin metabolic pathway via AKT phosphorylation in both cell lines while inducing pro-proliferative stimulus and modulation of cell distribution in cell cycle phases only in the hormone-responsive MCF-7 cell line. On the contrary, high-glucose containing medium alone did not modulate proliferation nor further increased it when combined with high insulin level in both the investigated cell lines. However, following insulin treatment, the MAPK pathway remained unaffected, suggesting that the proliferation effects in the MCF-7 cell line are mediated by AKT activation. This linkage was also demonstrated by AKT phosphorylation blockade, driven by the AKT inhibitor MK-2206, which negated the proliferative stimulus. Interestingly, while MDA-MB-231 cells, following chronic hyperinsulinemia exposure, did not exhibit enhanced proliferation, they displayed a marked increase in migratory behaviour. These findings suggest that chronic hyperinsulinemia, but not hyperglycaemia, exerts subtype-specific effects in BC, highlighting the potential of targeting insulin pathways for therapeutic intervention.

Keywords: breast cancer; hyperglycaemia; hyperinsulinemia; insulin signalling; type 2 diabetes mellitus.


Conflict of interest statement

The authors declare no conflicts of interest. Furthermore, the funders had no role in the design of the study; in the collection, analyses, or interpretation of data; in the writing of the manuscript; or in the decision to publish the results.

Figures

Figure 1
Figure 1
Insulin metabolic and mitogenic pathways analysis in MDA-MB-231 and MCF-7 cell lines. (A) Representative Western blot of the phosphorylation of AKT and ERK1/2 proteins in MDA-MB-231 cells treated with or without insulin 100 nM. Densitometric analysis of the phosphorylation of AKT (B) and ERK1/2 (C) in MDA-MB-231, normalised for their unphosphorylated form. (D) Representative Western blot of AKT and ERK1/2 phosphorylation after MCF-7 treatment with or without insulin. Densitometric analysis of the phosphorylation of AKT (E) and ERK1/2 (F) in MCF-7, normalised for their unphosphorylated form. (G) Immunofluorescence analysis of the phosphorylation of AKT Ser473 in untreated (left) and insulin-treated MDA-MB-231 cells (right). (H) Immunofluorescence analysis of the phosphorylation of AKT Ser473 (red) in untreated (left) and insulin-treated MCF-7 cells (right). Nuclei were counterstained with DAPI (blue). Scale bar = 25 µm. Western blot data are the mean of three independent biological replicates ± SEM. Statistical analysis was performed using a two-tailed t-test. ** p < 0.01, *** p < 0.001.
Figure 2
Figure 2
Chronic insulin effect on cell proliferation after 48 h of treatment with 25 nM insulin in the presence or absence of high-glucose containing medium. MDA-MB-231 cell proliferation analysed by flow cytometry (A) and by MTT assay (B). MCF-7 cell proliferation investigated by flow cytometry (C) and by MTT assay (D). Data are expressed in fold change relative to the control condition. Data are reported as the mean of three independent biological replicates ± SEM, except for the cell viability assay on MDA-MB-231 cells where the replicates were five and for the MTT assay on MCF-7 cells where the replicates were four. Statistical analysis was performed using the one-way Anova test. ** p < 0.01, *** p < 0.001, **** p < 0.0001. CTRL, control; INS, 25 nM insulin; HG, hyperglycaemia.
Figure 3
Figure 3
Insulin pathway activation following chronic insulin treatment. (A) Representative Western blot of the phosphorylation of AKT, mTOR, and ERK 1/2 in MDA-MB-231 cells treated with or without insulin 25 nM for 48 h. Densitometric analysis of the phosphorylation of AKT (B), mTOR (C), and ERK 1/2 (D) in MDA-MB-231 cells, normalised for their unphosphorylated form. (E) Representative Western blot of the phosphorylation of AKT, mTOR, and ERK 1/2 in MCF-7 cells treated with or without insulin 25 nM for 48 h. Densitometric analysis of the phosphorylation of AKT (F), mTOR (G), and ERK 1/2 (H) in MCF-7 cells, normalised for their unphosphorylated form. Western blot data are reported as the mean of three independent biological ± SEM. Statistical analysis was performed using a two-tailed t-test. * p < 0.05. CTRL, control; INS, 25 nM insulin.
Figure 4
Figure 4
Chronic insulin effect on cell cycle. Cell cycle analysis of MDA-MB-231 cells (A) and MCF-7 (B) after 48 h of exposure to 25 nM insulin. Data are reported as the means of three independent biological replicates ± SEM. Statistical analysis was performed using a two-way Anova followed by Sidak’s post hoc test. *** p < 0.001. CTRL, control; INS, 25 nM insulin.
Figure 5
Figure 5
Effect of AKT activation blockade in cell viability and metabolic insulin pathway. MK-2206-driven AKT blockade effect on the viability of MDA-MB-231 (A) and MCF-7 (B) cells treated for 48 h with or without high insulin levels. (C) Representative Western blot of the phosphorylation of the proteins AKT and GSK-3β in MDA-MB-231 cells treated with or without insulin 25 nM and MK-2206 for 48 h. Densitometric analysis of the phosphorylation of AKT (D) and GSK-3β (E) in MDA-MB-231 cells, normalised for their unphosphorylated form. (F) Representative Western blot of the phosphorylation of the proteins AKT and GSK-3β in MCF-7 cells treated with or without insulin 25 nM and MK-2206 for 48 h. Densitometric analysis of the phosphorylation of AKT (G) and GSK-3β (H) in MCF-7 cells, normalised for their unphosphorylated form. Reported data are reported as the means of three independent biological replicates ± SEM, except for the control condition of the MTT assay with MCF-7 cells where the replicates are six. Statistical analysis was performed using a two-way Anova test followed by Tukey’s post hoc test for proliferation data comparison and using a one-way Anova test followed by Tukey’s post hoc test for Western blot analysis. * p < 0.05, *** p < 0.001, **** p < 0.0001.
Figure 6
Figure 6
The effect of high insulin level on breast cancer cell migration. Real-time migration curves of MDA-MB-231 (A) and MCF-7 (B) cells treated with or without insulin 25 nM and in the presence or not of the chemoattractant. In panel A, the hyperinsulinemia condition curve is not visible due to complete overlap with the control curve. RTCA curves are the means of at least three technical replicates ± SEM. Statistical analysis was performed using a linear regression test. ** p < 0.01. RTCA, Real-Time Cell Analysis; CTRL, control; FBS, 10% Foetal Bovine Serum; INS, insulin.

Similar articles

References

    1. Hoca M., Becer E., Vatansever H.S. The role of resveratrol in diabetes and obesity associated with insulin resistance. Arch. Physiol. Biochem. 2023;129:555–561. doi: 10.1080/13813455.2021.1893338. - DOI - PubMed
    1. Magliano D.J., Boyko E.J., IDF Diabetes Atlas 10th edition scientific committee . IDF Diabetes Atlas. International Diabetes Federation; Brussels, Belgium: 2021.
    1. American Diabetes Association Classification and Diagnosis of Diabetes: Standards of Medical Care in Diabetes-2018. Diabetes Care. 2018;41:S13–S27. doi: 10.2337/dc18-S002. - DOI - PubMed
    1. Koh H.E., Cao C., Mittendorfer B. Insulin Clearance in Obesity and Type 2 Diabetes. Int. J. Mol. Sci. 2022;23:596. doi: 10.3390/ijms23020596. - DOI - PMC - PubMed
    1. Lee S.H., Park S.Y., Choi C.S. Insulin Resistance: From Mechanisms to Therapeutic Strategies. Diabetes Metab. J. 2022;46:15–37. doi: 10.4093/dmj.2021.0280. - DOI - PMC - PubMed

LinkOut - more resources