Review
. 2025 Aug 4;26(15):7525.
doi: 10.3390/ijms26157525.

Prevalence and Levels of Thyroid Autoantibodies in Polycystic Ovary Syndrome-Impact of TSH- and BMI-Matched Comparisons: A Systematic Review and Meta-Analysis

Affiliations
Review

Prevalence and Levels of Thyroid Autoantibodies in Polycystic Ovary Syndrome-Impact of TSH- and BMI-Matched Comparisons: A Systematic Review and Meta-Analysis

Jakub Kwiatkowski et al. Int J Mol Sci. .

Abstract

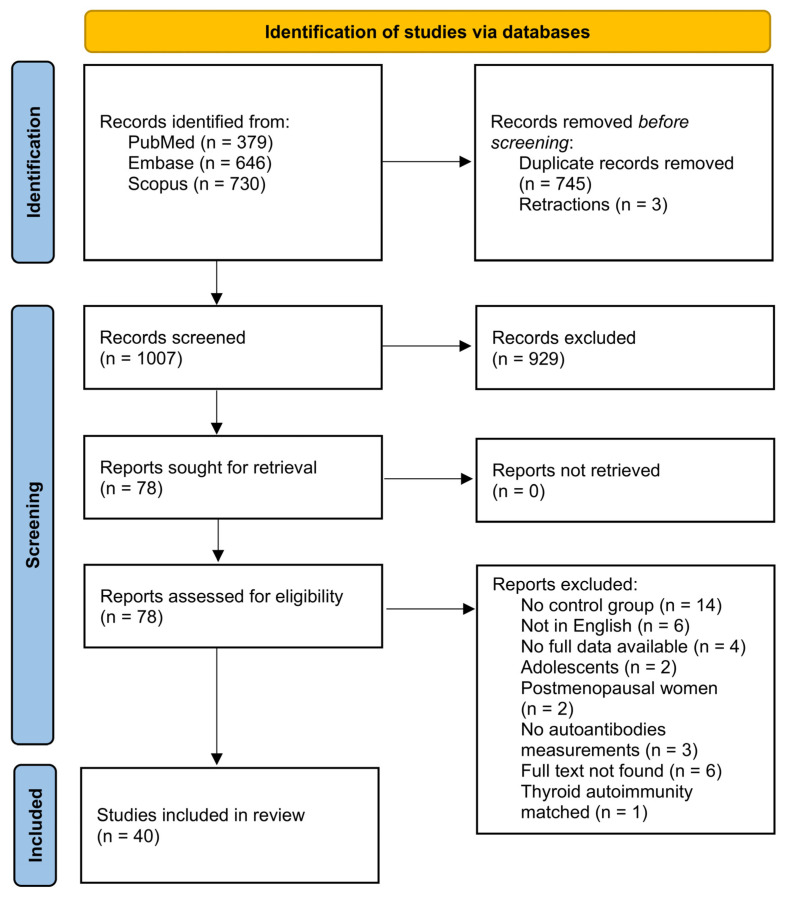
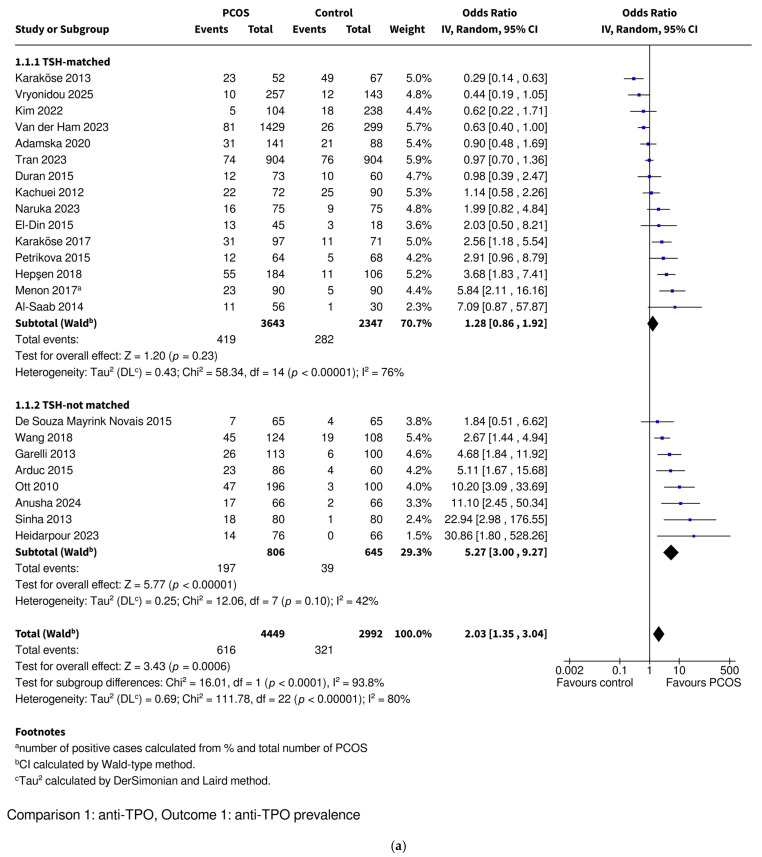
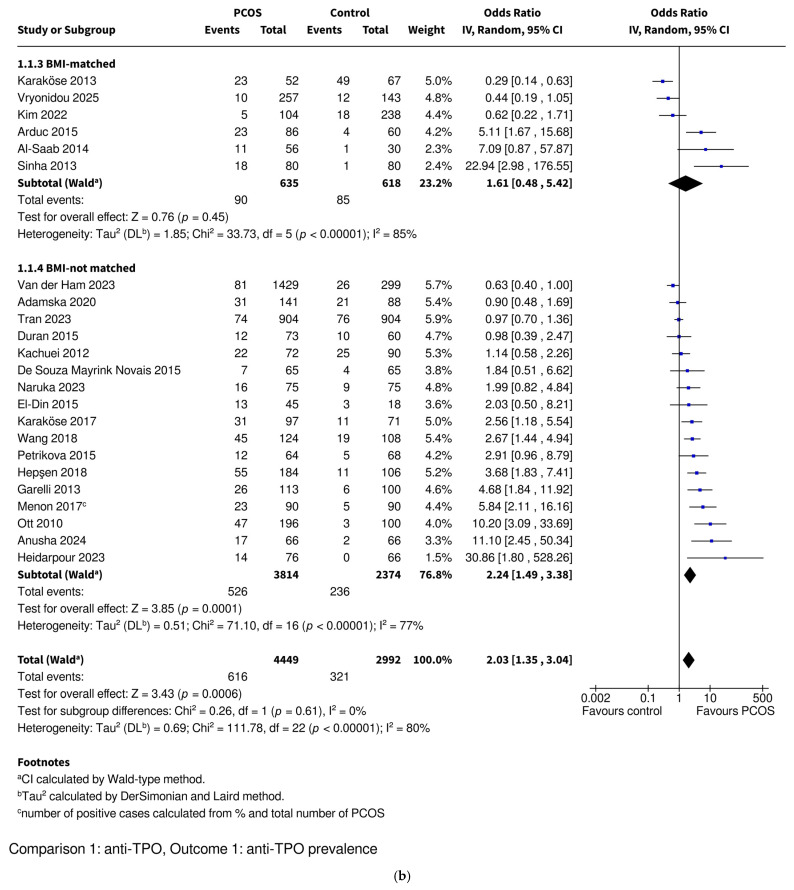
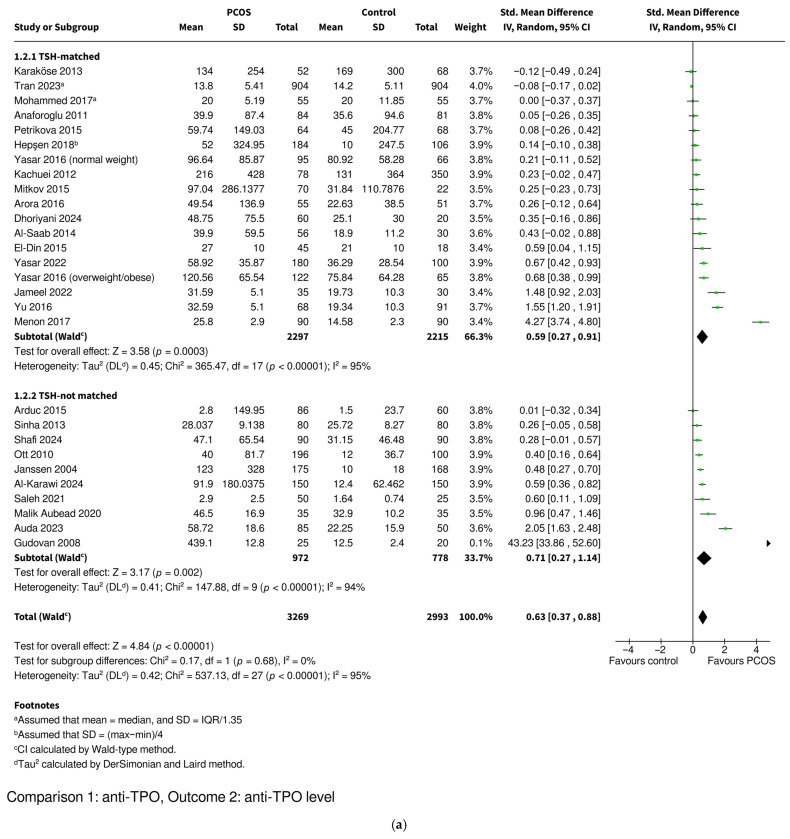
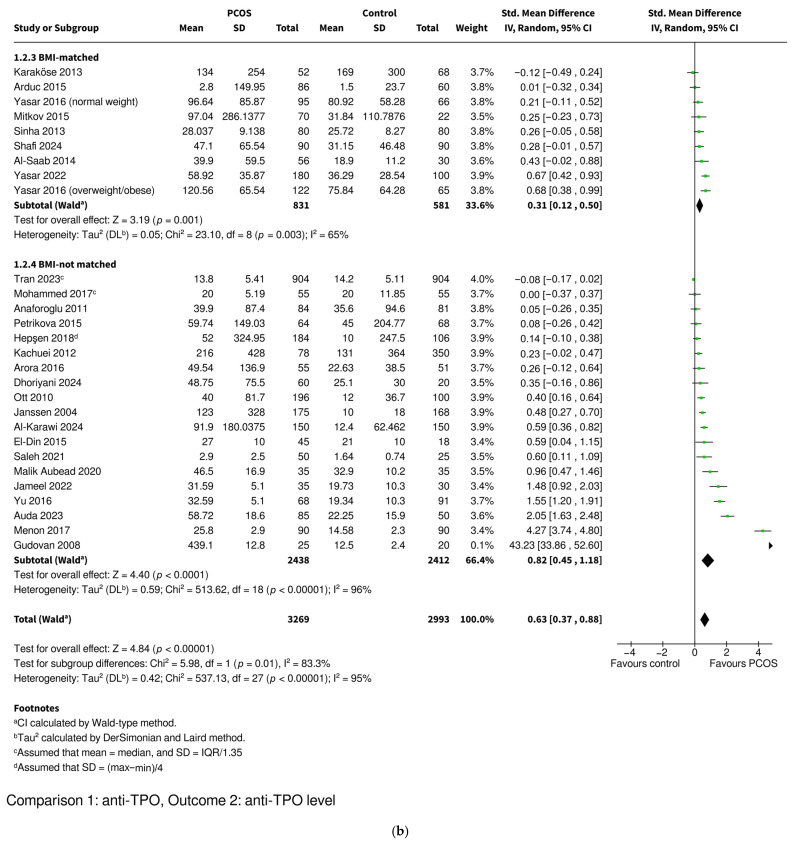
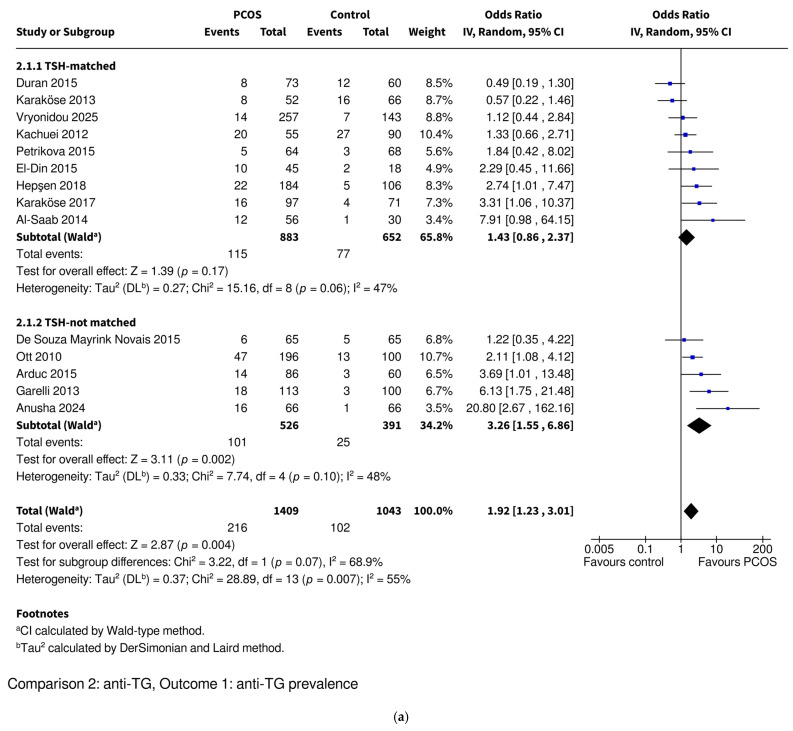
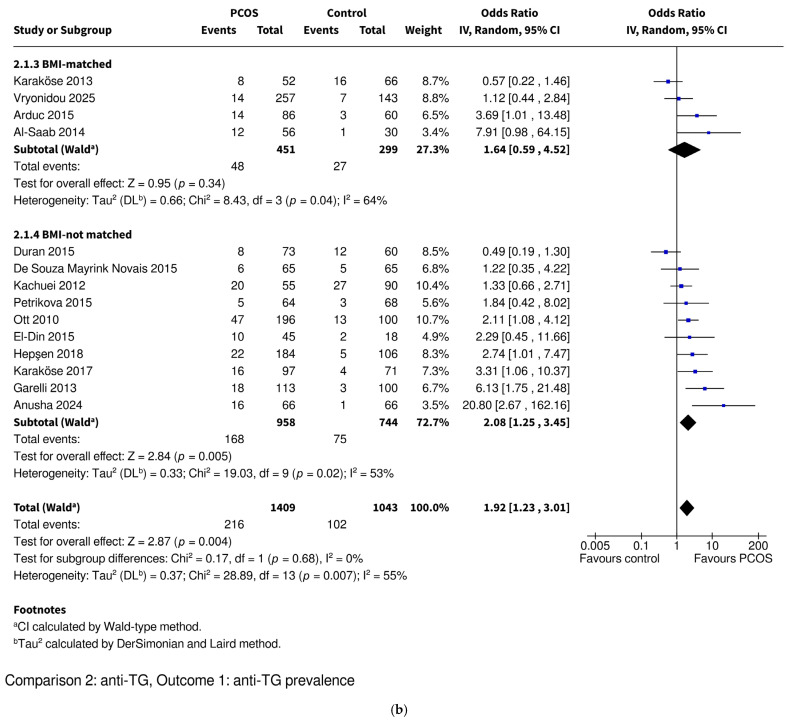
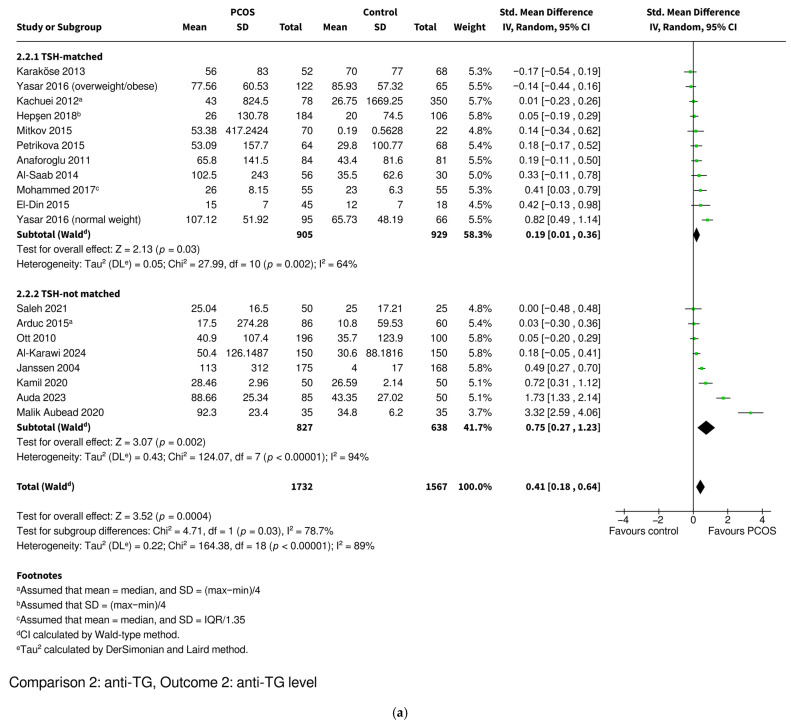
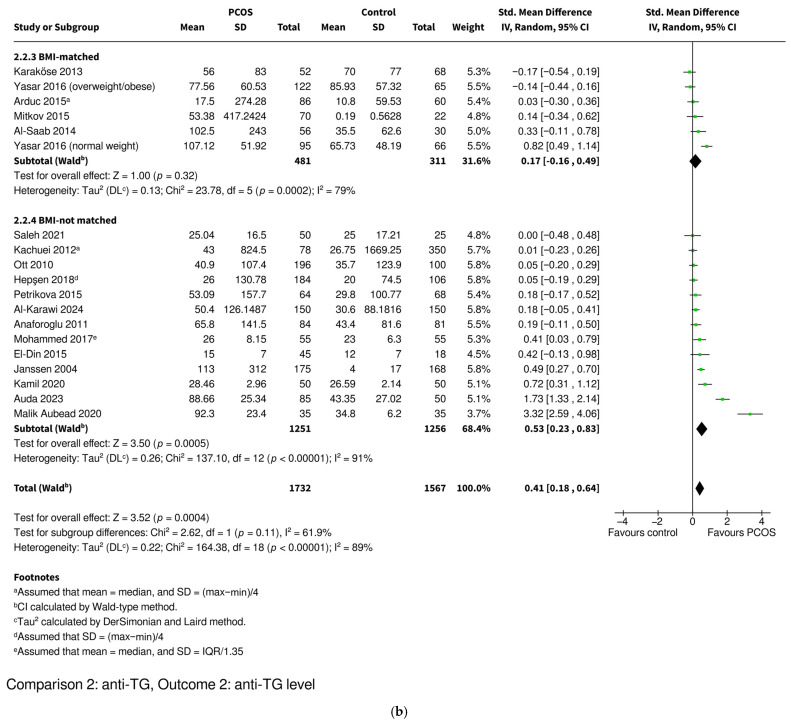
Polycystic ovary syndrome (PCOS) is a complex condition affecting women of reproductive age, characterized by menstrual irregularities, hyperandrogenism, polycystic ovarian morphology, and low-grade inflammation accompanied by oxidative stress and increased autoimmune risk, particularly Hashimoto's thyroiditis. Many studies have examined thyroid autoantibodies-anti-thyroid peroxidase antibodies (anti-TPO) and anti-thyroglobulin antibodies (anti-TG)-in PCOS; however, observed differences in baseline thyroid-stimulating hormone (TSH) levels and body mass indices (BMIs) impede a direct interpretation of the results. This systematic review and meta-analysis aimed to summarize the available evidence on the prevalence and levels of anti-TPO and anti-TG in women with PCOS. We conducted a systematic search of PubMed, Scopus, and Embase, which yielded 40 eligible, observational studies including 6045 women with PCOS and 4527 controls. Subgroup analyses were conducted separately for TSH- and BMI-matched populations. Anti-TPO prevalence (odds ratio [OR] = 2.03; 95% confidence interval [CI]: 1.35-3.04; p = 0.0006) and levels (standardized mean difference [SMD] = 0.63; 95% CI: 0.37-0.88; p < 0.00001) were significantly higher in PCOS patients. Anti-TG prevalence (OR = 1.92; 95% CI: 1.23-3.01; p = 0.004) and levels (SMD = 0.41; 95% CI: 0.18-0.64; p = 0.0004) were also significantly elevated. In matched subgroups, prevalence differences were no longer significant, though anti-TPO levels remained significantly elevated and anti-TG levels were borderline significant in the TSH-matched subgroup of PCOS women. Although differences in thyroid autoantibody prevalence in women with PCOS appear to be driven by elevated TSH levels and BMIs, the persistently increased antibody levels in the majority of matched subgroups suggest that PCOS itself may contribute independently to heightened autoimmune activation.

Keywords: Hashimoto’s thyroiditis; PCOS; anti-TG; anti-TPO; anti-thyroglobulin antibodies; anti-thyroid peroxidase antibodies; antibodies; autoimmune thyroid disease; autoimmunity; polycystic ovary syndrome.


Conflict of interest statement

The authors declare no conflicts of interest.

Figures

Figure 1
Figure 1
Preferred Reporting Items for Systematic Reviews and Meta-Analyses (PRISMA) flow diagram of the study selection process.
Figure 2
Figure 2
Forest plot of observational studies investigating the association between the prevalence of anti-TPO autoantibodies and polycystic ovary syndrome. The studies were subcategorized into (a) TSH-matched and TSH-not matched groups and (b) BMI-matched and BMI-not matched groups. The TSH-not matched subgroup includes studies where TSH levels were significantly higher in the PCOS group or where no data on TSH levels was available. The BMI-not matched subgroup includes studies where BMIs were significantly higher in the PCOS group or where no data on BMI was available. Anti-TPO—anti-thyroid peroxidase antibodies; BMI—body mass index; CI—confidence interval; IV—inverse variance; OR—odds ratio; PCOS—polycystic ovary syndrome. References: [28,32,33,37,38,39,41,42,43,46,48,49,51,52,53,54,55,57,58,59,63,64,66].
Figure 2
Figure 2
Forest plot of observational studies investigating the association between the prevalence of anti-TPO autoantibodies and polycystic ovary syndrome. The studies were subcategorized into (a) TSH-matched and TSH-not matched groups and (b) BMI-matched and BMI-not matched groups. The TSH-not matched subgroup includes studies where TSH levels were significantly higher in the PCOS group or where no data on TSH levels was available. The BMI-not matched subgroup includes studies where BMIs were significantly higher in the PCOS group or where no data on BMI was available. Anti-TPO—anti-thyroid peroxidase antibodies; BMI—body mass index; CI—confidence interval; IV—inverse variance; OR—odds ratio; PCOS—polycystic ovary syndrome. References: [28,32,33,37,38,39,41,42,43,46,48,49,51,52,53,54,55,57,58,59,63,64,66].
Figure 3
Figure 3
Forest plot of observational studies investigating the association between the level of anti-TPO autoantibodies and polycystic ovary syndrome. The studies were subcategorized into (a) TSH-matched and TSH-not matched groups and (b) BMI-matched and BMI-not matched groups. The TSH-not matched subgroup includes studies where TSH levels were significantly higher in the PCOS group or where no data on TSH levels was available. The BMI-not matched subgroup includes studies where BMIs were significantly higher in the PCOS group or where no data on BMI was available. Anti-TPO—anti-thyroid peroxidase antibodies; BMI—body mass index; CI—confidence interval; IV—inverse variance; PCOS—polycystic ovary syndrome; SD—standard deviation; Std. Mean Difference—standardized mean difference; TSH—thyroid-stimulating hormone. References: [29,30,34,35,36,38,40,41,42,44,45,46,47,49,50,53,55,56,57,58,60,61,62,63,64,65,67].
Figure 3
Figure 3
Forest plot of observational studies investigating the association between the level of anti-TPO autoantibodies and polycystic ovary syndrome. The studies were subcategorized into (a) TSH-matched and TSH-not matched groups and (b) BMI-matched and BMI-not matched groups. The TSH-not matched subgroup includes studies where TSH levels were significantly higher in the PCOS group or where no data on TSH levels was available. The BMI-not matched subgroup includes studies where BMIs were significantly higher in the PCOS group or where no data on BMI was available. Anti-TPO—anti-thyroid peroxidase antibodies; BMI—body mass index; CI—confidence interval; IV—inverse variance; PCOS—polycystic ovary syndrome; SD—standard deviation; Std. Mean Difference—standardized mean difference; TSH—thyroid-stimulating hormone. References: [29,30,34,35,36,38,40,41,42,44,45,46,47,49,50,53,55,56,57,58,60,61,62,63,64,65,67].
Figure 4
Figure 4
Forest plot of observational studies investigating the association between the prevalence of anti-TG autoantibodies and polycystic ovary syndrome. The studies were subcategorized into (a) TSH-matched and TSH-not matched groups and (b) BMI-matched and BMI-not matched groups. The TSH-not matched subgroup includes studies where TSH levels were significantly higher in the PCOS group or where no data on TSH levels was available. The BMI-not matched subgroup includes studies where BMIs were significantly higher in the PCOS group or where no data on BMI was available. Anti-TG—anti-thyroglobulin antibodies; BMI—body mass index; CI—confidence interval; IV—inverse variance; OR—odds ratio; PCOS—polycystic ovary syndrome; TSH—thyroid-stimulating hormone. References: [46,48,49,51,52,53,54,55,57,58,59,63,64,66].
Figure 4
Figure 4
Forest plot of observational studies investigating the association between the prevalence of anti-TG autoantibodies and polycystic ovary syndrome. The studies were subcategorized into (a) TSH-matched and TSH-not matched groups and (b) BMI-matched and BMI-not matched groups. The TSH-not matched subgroup includes studies where TSH levels were significantly higher in the PCOS group or where no data on TSH levels was available. The BMI-not matched subgroup includes studies where BMIs were significantly higher in the PCOS group or where no data on BMI was available. Anti-TG—anti-thyroglobulin antibodies; BMI—body mass index; CI—confidence interval; IV—inverse variance; OR—odds ratio; PCOS—polycystic ovary syndrome; TSH—thyroid-stimulating hormone. References: [46,48,49,51,52,53,54,55,57,58,59,63,64,66].
Figure 5
Figure 5
Forest plot of observational studies investigating the association between the level of anti-TG autoantibodies and polycystic ovary syndrome. The studies were subcategorized into (a) TSH-matched and TSH-not matched groups and (b) BMI-matched and BMI-not matched groups. The TSH-not matched subgroup includes studies where TSH levels were significantly higher in the PCOS group or where no data on TSH levels was available. The BMI-not matched subgroup includes studies where BMIs were significantly higher in the PCOS group or where no data on BMI was available. Anti-TG—anti-thyroglobulin antibodies; BMI—body mass index; CI—confidence interval; IV—inverse variance; PCOS—polycystic ovary syndrome; SD—standard deviation; Std. Mean Difference—standardized mean difference; TSH—thyroid-stimulating hormone. References: [29,31,46,47,49,50,53,55,56,57,58,60,61,62,63,64,65,67].
Figure 5
Figure 5
Forest plot of observational studies investigating the association between the level of anti-TG autoantibodies and polycystic ovary syndrome. The studies were subcategorized into (a) TSH-matched and TSH-not matched groups and (b) BMI-matched and BMI-not matched groups. The TSH-not matched subgroup includes studies where TSH levels were significantly higher in the PCOS group or where no data on TSH levels was available. The BMI-not matched subgroup includes studies where BMIs were significantly higher in the PCOS group or where no data on BMI was available. Anti-TG—anti-thyroglobulin antibodies; BMI—body mass index; CI—confidence interval; IV—inverse variance; PCOS—polycystic ovary syndrome; SD—standard deviation; Std. Mean Difference—standardized mean difference; TSH—thyroid-stimulating hormone. References: [29,31,46,47,49,50,53,55,56,57,58,60,61,62,63,64,65,67].

Similar articles

References

    1. Ganie M.A., Vasudevan V., Wani I.A., Baba M.S., Arif T., Rashid A. Epidemiology, pathogenesis, genetics & management of polycystic ovary syndrome in India. Indian J. Med. Res. 2019;150:333–344. doi: 10.4103/ijmr.IJMR_1937_17. - DOI - PMC - PubMed
    1. Cunha A., Povoa A.M. Infertility management in women with polycystic ovary syndrome: A review. Porto Biomed. J. 2021;6:e116. doi: 10.1097/j.pbj.0000000000000116. - DOI - PMC - PubMed
    1. Su P., Chen C., Sun Y. Physiopathology of polycystic ovary syndrome in endocrinology, metabolism and inflammation. J. Ovarian Res. 2025;18:34. doi: 10.1186/s13048-025-01621-6. - DOI - PMC - PubMed
    1. Christakou C.D., Diamanti-Kandarakis E. Role of androgen excess on metabolic aberrations and cardiovascular risk in women with polycystic ovary syndrome. Womens Health. 2008;4:583–594. doi: 10.2217/17455057.4.6.583. - DOI - PubMed
    1. Liu Q., Tang B., Zhu Z., Kraft P., Deng Q., Stener-Victorin E., Jiang X. A genome-wide cross-trait analysis identifies shared loci and causal relationships of type 2 diabetes and glycaemic traits with polycystic ovary syndrome. Diabetologia. 2022;65:1483–1494. doi: 10.1007/s00125-022-05746-x. - DOI - PMC - PubMed

LinkOut - more resources