. 2025 Aug 4;26(15):7539.
doi: 10.3390/ijms26157539.

Mechanotransduction-Driven Modulation of L-Type Calcium Channels: Roles of Nitric Oxide, S-Nitrosylation, and cGMP in Rat Ventricular Cardiomyocytes

Affiliations

Mechanotransduction-Driven Modulation of L-Type Calcium Channels: Roles of Nitric Oxide, S-Nitrosylation, and cGMP in Rat Ventricular Cardiomyocytes

Olga V Kamkina et al. Int J Mol Sci. .

Abstract

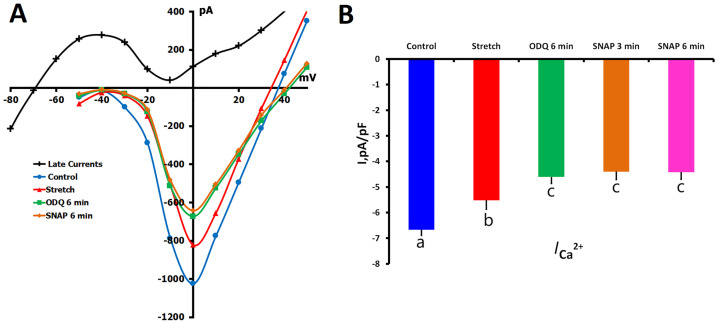
L-type Ca2+ channels, particularly CaV1.2, play a crucial role in cardiac excitation-contraction coupling and are known to exhibit mechanosensitivity. However, the mechanisms regulating their response to mechanical stress remain poorly understood. To investigate the mechanosensitivity and nitric oxide (NO)-dependent regulation of L-type Ca2+ channels in rat ventricular cardiomyocytes, we used RNA sequencing to assess isoform expression and whole-cell patch-clamp recordings to measure L-type Ca2+ current (ICa,L) under controlled mechanical and pharmacological conditions. RNA sequencing revealed predominant expression of CaV1.2 (TPM: 0.1170 ± 0.0075) compared to CaV1.3 (0.0021 ± 0.0002) and CaV1.1 (0.0002 ± 0.0002). Local axial stretch (6-10 μm) consistently reduced ICa,L in proportion to stretch magnitude. The NO donor SNAP (200 μM) had variable effects on basal ICa,L in unstretched cells (stimulatory, inhibitory, or biphasic) but consistently restored stretch-reduced ICa,L to control levels. Ascorbic acid (10 μM), which reduces S-nitrosylation, increased basal ICa,L and partially restored the reduction caused by stretch, implicating S-nitrosylation in channel regulation. The sGC inhibitor ODQ (5 μM) decreased ICa,L in both stretched and unstretched cells, indicating involvement of the NO-cGMP pathway. Mechanical stress modulates L-type Ca2+ channels through a complex interplay between S-nitrosylation and NO-cGMP signaling, with S-nitrosylation playing a predominant role in stretch-induced effects. This mechanism may represent a key component of cardiac mechanotransduction and could be relevant for therapeutic targeting in cardiac pathologies involving mechanically induced dysfunction.

Keywords: L-type Ca2+ channels; NO-cGMP; S-nitrosylation; cardiomyocytes; mechanosensitivity; nitric oxide.


Conflict of interest statement

The authors declare no conflicts of interest.

Figures

Figure 1
Figure 1
RNA sequencing-based expression profiles of voltage-gated calcium channels and their auxiliary subunits in rat ventricular cardiomyocytes. (A) Transcript abundance of pore-forming α1 subunits, expressed as transcripts per million (TPM) ± SEM (n = three biological replicates). (B) Expression profile of auxiliary subunits associated with L-type calcium channels. TPM values ± SEM are shown for three biological replicates.
Figure 2
Figure 2
Effects of mechanical stretch on L-type Ca2+ current (ICa,L) in rat ventricular cardiomyocytes. (A) Representative whole-cell ICa,L traces recorded under control conditions (a) and during mechanical stretch of 6 μm (b), 8 μm (c), and 10 μm (d). Currents were elicited using a standard depolarizing pulse protocol (for details, please see the Materials and Methods section). (B) Current–voltage (I/V) relationships of ICa,L under control conditions and during mechanical stretch of 6, 8, and 10 μm. The net late current (IL,Net; for clarification, please see the Materials and Methods section) is shown in black, indicating time-dependent decay during sustained depolarization. (C) Mean peak ICa,L current density (pA/pF) under control conditions and at increasing levels of stretch (6, 8, and 10 μm). Lowercase letters (a, b, c, d) above the bars indicate statistically significant differences between the groups (p < 0.05). Statistical comparisons were made using repeated measures ANOVA with the Holm–Sidak post hoc test. The data are presented as mean ± SEM. Superimposed traces in panels (A(ad)) partially overlap at later time points due to the nature of multi-trace electrophysiological recordings. This overlap does not affect the interpretation of current amplitude, kinetics, or time scale.
Figure 3
Figure 3
Effects of SNAP (200 µmol/L) on ICa,L in unstretched cells in K+in/K+out solutions: (reduction in ICa,L (A,B), enhancement of ICa,L (C,D), and no significant current size change (E,F). (A) Representative I/V curves under control conditions and following 3, 6, 9, and 12 min of SNAP application. Cell capacitance = 175 pF. (B) Mean ICa,L density at baseline and after 3, 6, 9, and 12 min of SNAP exposure. Lowercase letters (a, b, c) above bars indicate statistically significant differences between the time points (p < 0.05). (C) I/V curves showing ICa,L under control conditions and at 3, 6, and 9 min after SNAP application. Cell capacitance = 170 pF. (D) Mean ICa,L density at baseline and during SNAP exposure. Lowercase letters (a, b) denote significant differences between groups (p < 0.05). (E) I/V curves recorded under control conditions and following 3, 6, and 9 min of SNAP application. Cell capacitance = 120 pF. (F) Mean ICa,L density remained unchanged over time (p = ns across all time points). Lowercase letters (a) indicate no statistically significant differences between groups. For all I/V plots (A,C,E), the net late current (IL,Net) used for ICa,L calculation is depicted in black. Statistical comparisons were made using repeated measures ANOVA with the Holm–Sidak post hoc test. The data are presented as mean ± SEM.
Figure 4
Figure 4
Effects of mechanical stretch and SNAP application on ICa,L in rat ventricular cardiomyocytes. Experiments were performed in K+in/K+out solutions to evaluate how SNAP (200 µM) modulates ICa,L during and after mechanical stretch. (A) Representative I/V curves show ICa,L under control conditions (blue circles), during 6 μm axial stretch (red triangles), and after 1 min of SNAP application while stretch was maintained (green squares). Cell capacitance = 135 pF. (B) Mean ICa,L densities corresponding to each condition. Lowercase letters (a, b) above the bars indicate statistically significant differences between the groups (p < 0.05). (C) I/V curves demonstrate ICa,L under control conditions (blue circles), after 2 min of SNAP application (red triangles), and during subsequent 6 μm stretch (green squares). Cell capacitance = 150 pF. (D) Mean ICa,L densities for each condition. Lowercase letters (a, b, c) above the bars indicate statistically significant differences between the groups (p < 0.05). For both (A,C), the net late current (IL,Net) used to calculate ICa,L is shown as a black curve. Statistical comparisons were made using repeated measures ANOVA with the Holm–Sidak post hoc test. Data are presented as mean ± SEM.
Figure 5
Figure 5
Effects of ODQ (5 µM) and SNAP (200 µM) on ICa,L in unstretched rat ventricular cardiomyocytes. Experiments were conducted in K+in/K+out solutions to assess the influence of soluble guanylyl cyclase (sGC) inhibition and subsequent NO donor application on ICa,L. (A) Representative I/V curves show ICa,L under control conditions (blue circles), after 6 min of ODQ application (red triangles), and following SNAP addition at 3 min (green squares) and 6 min (orange diamonds). The late component of the current (IL,Net), used for current density calculation, is shown in black. Cell capacitance = 155 pF. (B) Mean ICa,L densities for each condition. Lowercase letters (a, b, c) above the bars indicate statistically significant differences between the groups (p < 0.05). Statistical comparisons were made using repeated measures ANOVA with the Holm–Sidak post hoc test. Data are presented as mean ± SEM.
Figure 6
Figure 6
Combined effects of mechanical stretch, ODQ (5 µM), and SNAP (200 µM) on ICa,L in rat ventricular cardiomyocytes. Experiments were performed in K+in/K+out solutions to assess how sGC inhibition and NO signaling interact with mechanical stress to regulate ICa,L. (A) Representative I/V curves show ICa,L under control conditions (blue circles), during local axial stretch of 6 μm (red triangles), and after 6 min of ODQ application while stretch was maintained (green squares). The net late current (IL,Net), used for current density calculation, is shown in black. Cell capacitance = 170 pF. (B) Mean ICa,L densities under each condition. Lowercase letters (a, b, c) above the bars indicate statistically significant differences between the groups (p < 0.05). Statistical analysis was performed using repeated measures ANOVA with the Holm–Sidak post hoc test. Data are presented as mean ± SEM.
Figure 7
Figure 7
Effects of ascorbic acid (AA, 10 µM) and SNAP (200 µM) on ICa,L in unstretched rat ventricular cardiomyocytes. Experiments were performed in K+in/K+out solutions to evaluate how AA modulates ICa,L under basal conditions and in the presence of the NO donor SNAP. (A) Representative I/V curves showing ICa,L under control conditions (blue circles), after 6 min of AA perfusion (red triangles), and following an additional 6 min of SNAP application in the presence of AA (green squares). The net late current (IL,Net) is shown in black; cell capacitance = 180 pF. (B) Mean ICa,L values under the same conditions. Lowercase letters (a, b) above the bars indicate statistically significant differences between the groups (p < 0.05). (C) I/V curves show ICa,L under control conditions (blue circles), after 6 min of SNAP application (red triangles), and following 6 min of AA perfusion (green squares); cell capacitance = 135 pF. (D) Mean ICa,L values under the same conditions. Lowercase letters (a, b, c) above the bars indicate statistically significant differences between the groups (p < 0.05). (E) I/V curves show ICa,L under control conditions (blue circles), after 6 min of SNAP application (red triangles), and following an additional 6 min of AA application (green squares); cell capacitance = 155 pF. (F) Mean ICa,L values under the same conditions. Lowercase letters (a, b, c) above the bars indicate statistically significant differences between the groups (p < 0.05). In all panels (A,C,E), IL,Net used for current density calculation is shown in black. Statistical analysis was performed using repeated measures ANOVA with the Holm–Sidak post hoc test. Data are presented as mean ± SEM.
Figure 8
Figure 8
Effects of ascorbic acid (AA, 10 µM) and SNAP (200 µM) on ICa,L in mechanically stretched rat ventricular cardiomyocytes. Experiments were conducted in K+in/K+out solutions to assess whether AA and SNAP modulate stretch-induced suppression of ICa,L. (A) Representative I/V curves show ICa,L under control conditions (blue circles), during 6 μm axial stretch (red triangles), and after 6 min of AA perfusion while stretch was maintained (green squares). Subsequent SNAP application for 6 min produced no additional significant change (orange diamonds). The late current (IL,Net) used for ICa,L calculation is shown in black; cell capacitance = 170 pF. (B) Mean ICa,L densities across all conditions. Lowercase letters (a, b, c) above the bars indicate statistically significant differences between the groups (p < 0.05). Statistical analysis was performed using repeated measures ANOVA with the Holm–Sidak post hoc test. Data are presented as mean ± SEM.
Figure 9
Figure 9
Biphasic effects of N-ethylmaleimide (NEM, 200 µM) on ICa,L in unstretched rat ventricular cardiomyocytes at 22 °C. Experiments were conducted in K+in/K+out solutions to evaluate the time-dependent effects of thiol alkylation by NEM on ICa,L under basal (unstretched) conditions. (A) Representative I/V curves show ICa,L at baseline (blue circles) and following 3 min (red triangles), 6 min (green squares), 9 min (orange diamonds), and 12 min (purple stars) of continuous NEM perfusion. The net late current (IL,Net) used for current calculation is shown in black. Cell capacitance = 160 pF. (B) Mean ICa,L densities corresponding to each time point. Lowercase letters (a, b, c, d) above the bars indicate statistically significant differences between the groups (p < 0.05). Statistical comparisons were made using repeated measures ANOVA with the Holm–Sidak post hoc test. Data are presented as mean ± SEM.
Figure 10
Figure 10
Effects of N-ethylmaleimide (NEM, 200 µM) and SNAP (200 µM) on ICa,L during mechanical stretch in rat ventricular cardiomyocytes at 22 °C. Experiments were performed in K+in/K+out solutions to evaluate how thiol alkylation by NEM and NO signaling via SNAP affect ICa,L under conditions of mechanical stress. (A) Representative I/V curves show ICa,L under control conditions (blue circles), after 6 μm axial stretch (red triangles), and following 6 min of NEM perfusion during stretch (green squares). The net late current (IL,Net) used for current calculation is shown in black. Cell capacitance = 130 pF. (B) Mean ICa,L densities under the same conditions. Lowercase letters (a, b, c) above the bars indicate statistically significant differences between the groups (p < 0.05). (C) I/V curves show ICa,L under control conditions (blue circles), after 3 min of NEM perfusion (red triangles), and after an additional 6 min of NEM (green squares). IL,Net is shown as a black curve; cell capacitance = 130 pF. (D) Mean ICa,L densities for each condition. Lowercase letters (a, b, c, d) above the bars indicate statistically significant differences between the groups (p < 0.05). Statistical comparisons were made using repeated measures ANOVA with the Holm–Sidak post hoc test. Data are presented as mean ± SEM.

Similar articles

References

    1. Bers D.M. Cardiac excitation–contraction coupling. Nature. 2002;415:198–205. doi: 10.1038/415198a. - DOI - PubMed
    1. Lyford G.L., Strege P.R., Shepard A., Ou Y., Ermilov L., Miller S.M., Gibbons S.J., Farrugia G. α(1C) (Ca(v)1.2) L-type calcium channel mediates mechanosensitive calcium regulation. Am. J. Physiol.-Cell Physiol. 2002;283:C1001–C1008. doi: 10.1152/ajpcell.00140.2002. - DOI - PubMed
    1. Vincent P.F., Bouleau Y., Petit C., Dulon D. A synaptic F-actin network controls otoferlin-dependent exocytosis in auditory inner hair cells. eLife. 2015;4:e10988. doi: 10.7554/eLife.10988. - DOI - PMC - PubMed
    1. Ziolo M.T. The fork in the nitric oxide road: Cyclic GMP or nitrosylation? Nitric Oxide. 2008;18:153–156. doi: 10.1016/j.niox.2008.01.008. - DOI - PMC - PubMed
    1. Boycott H.E., Nguyen M.N., Vrellaku B., Gehmlich K., Robinson P. Nitric oxide and mechano-electrical transduction in cardiomyocytes. Front. Physiol. 2020;11:1629. doi: 10.3389/fphys.2020.606740. - DOI - PMC - PubMed

LinkOut - more resources