. 2025 Aug 4;26(15):7540.
doi: 10.3390/ijms26157540.

Promoter H3K4me3 and Gene Expression Involved in Systemic Metabolism Are Altered in Fetal Calf Liver of Nutrient-Restricted Dams

Affiliations

Promoter H3K4me3 and Gene Expression Involved in Systemic Metabolism Are Altered in Fetal Calf Liver of Nutrient-Restricted Dams

Susumu Muroya et al. Int J Mol Sci. .

Abstract

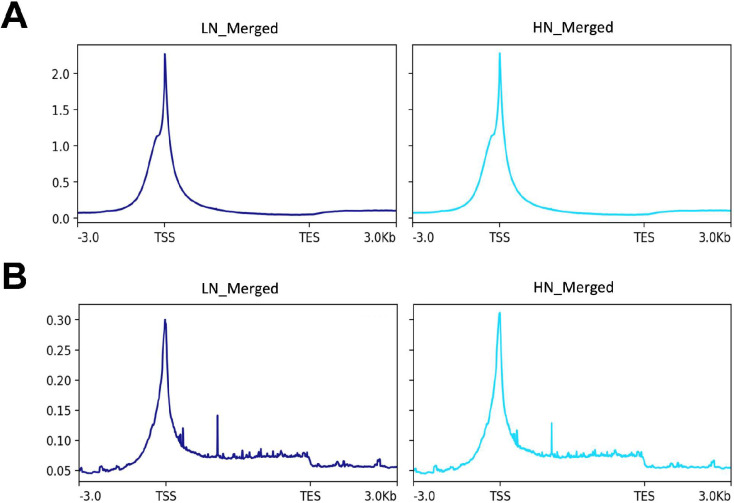
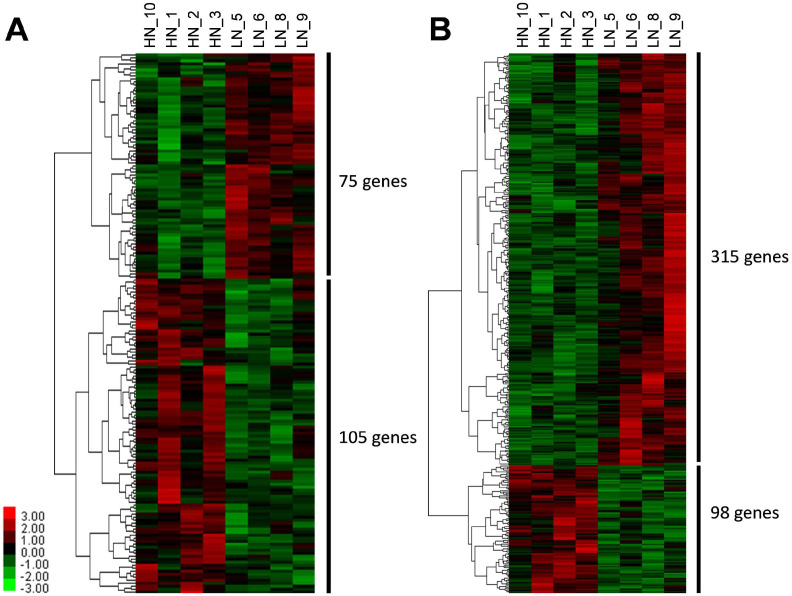
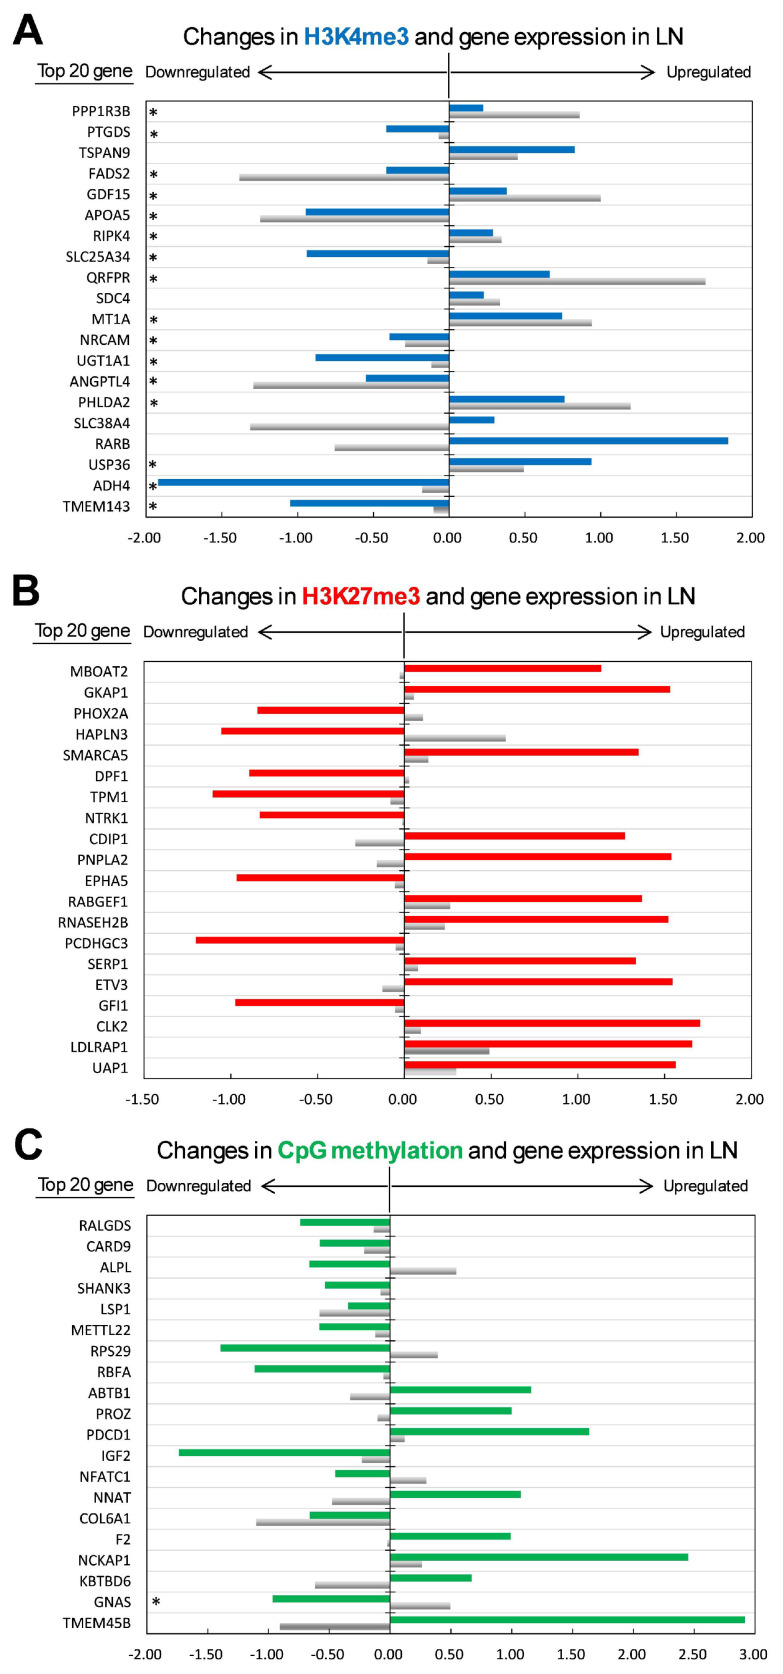
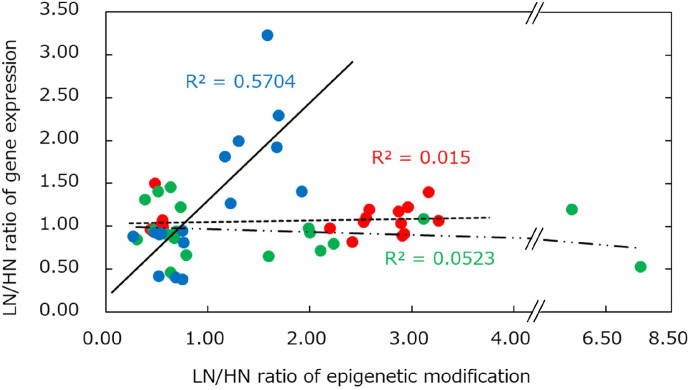
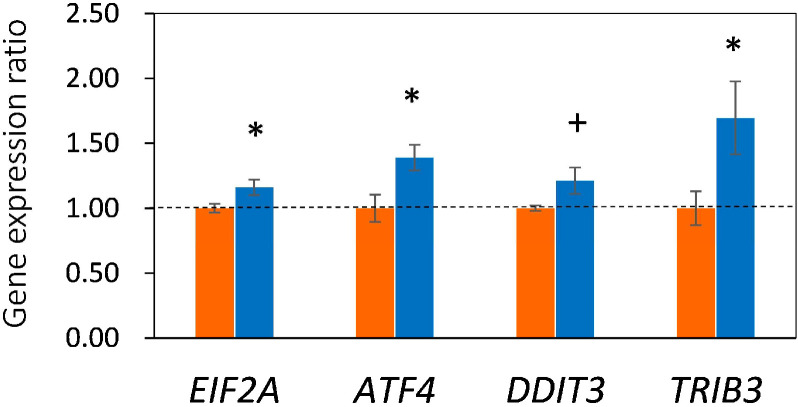
Maternal undernutrition (MUN) causes severe metabolic disruption in the offspring of mammals. Here we determined the role of histone modification in hepatic gene expression in late-gestation fetuses of nutritionally restricted cows, an established model using low-nutrition (LN) and high-nutrition (HN) conditions. The chromatin immunoprecipitation sequencing results show that genes with an altered trimethylation of histone 3 lysine 4 (H3K4me3) are associated with cortisol synthesis and secretion, the PPAR signaling pathway, and aldosterone synthesis and secretion. Genes with the H3K27me3 alteration were associated with glutamatergic synapse and gastric acid secretion. Compared to HN fetuses, promoter H3K4me3 levels in LN fetuses were higher in GDF15, IRF2BP2, PPP1R3B, and QRFPR but lower in ANGPTL4 and APOA5. Intriguingly, genes with the greatest expression changes (>1.5-fold) exhibited the anticipated up-/downregulation from elevated or reduced H3K4me3 levels; however, a significant relationship was not observed between promoter CpG methylation or H3K27me3 and the gene set with the greatest expression changes. Furthermore, the stress response genes EIF2A, ATF4, DDIT3, and TRIB3 were upregulated in the MUN fetal liver, suggesting involvement of the response in GDF15 activation. Thus, H3K4me3 likely plays a crucial role in MUN-induced physiological adaptation, altering the hepatic gene expression responsible for the integrated stress response and systemic energy metabolism, especially circulating lipoprotein lipase regulation.

Keywords: epigenetics; fetal growth restriction; histone modification; integrated stress response; liver; maternal undernutrition; metabolic programming.


Conflict of interest statement

The authors declare that there are no conflicts of interest.

Figures

Figure 1
Figure 1
Distribution of histone marks in a region from −3 kb from the transcription starting site (TSS) to +3 kb from the transcriptional ending site (TES). (A); H3K4me3, (B); H3K27me3. LN; low nutrition, HN; high nutrition. The input sample of pooled LN and HN samples is used as a control.
Figure 2
Figure 2
Hierarchical clustering analysis results of differentially histone-modified genes (DHG). DHGs were extracted by difference at p < 0.01. (A) H3K4me3, (B) H3K27me3. LN; low nutrition, HN; high nutrition.
Figure 3
Figure 3
Difference in LN/HN ratio of epigenetic modification and gene expression between epigenetic modifications ((A): H3K4me3, (B): H3K27me3, (C): CpG methylation). Regulatory impact on gene expression was analyzed using the top 20 genes for each modification. Theoretical consistence: genes are marked with * if satisfying (1) a significant difference in expression between LN and HN at p < 0.05 and (2) altered expression toward the predicted up/down direction by the epigenetic modification. It is generally accepted that increasing the promoter H3K4me3 level activates gene expression, meaning that changes in H3K4me3 and gene expression are positively correlated. Meanwhile, increasing promoter H3K27me3 or CpG methylation suppresses gene expression, meaning that changes in the epigenetic modification and gene expression by MUN are negatively correlated. Horizontal and vertical axes indicate levels of HN/LN ratio (log2(LN/HN) value) and epigenetically changed genes, respectively. The bar color blue, H3K4me3; red, H3K27me3; green, CpG methylation; gray, gene expression.
Figure 4
Figure 4
Relationships between changes in epigenetic modification and gene expression levels. Horizontal and vertical axes indicate the epigenetic modification ratio of low nutrition to high nutrition (LN/HN) and that of gene expression, respectively. The top 20 highly modified genes for each epigenetic modifier are plotted (see Figure 3). Regarding H3K4me3, genes without significantly altered gene expression (p ≥ 0.05) are not plotted. Blue; H3K4me3 (—), red; H3K27me3 (---) green; CpG methylation (− ∙ ∙).
Figure 5
Figure 5
Gene expression ratio of low nutrition to high nutrition (LN/HN) of EIF2A, ATF4, DDIT3, and TRIB3. * and + indicate difference at p < 0.05 and p < 0.10, respectively. HN, orange, LN; blue.

Similar articles

References

    1. Mwangi F.W., Charmley E., Gardiner C.P., Malau-Aduli B.S., Kinobe R.T., Malau-Aduli A.E.O. Diet and Genetics Influence Beef Cattle Performance and Meat Quality Characteristics. Foods. 2019;8:648. doi: 10.3390/foods8120648. - DOI - PMC - PubMed
    1. Devaskar S.U., Chu A. Intrauterine Growth Restriction: Hungry for an Answer. Physiology. 2016;31:131–146. doi: 10.1152/physiol.00033.2015. - DOI - PMC - PubMed
    1. Govoni K.E., Reed S.A., Zinn S.A. Cell Biology Symposium: Metabolic Responses to Stress: From Animal to Cell: Poor maternal nutrition during gestation: Effects on offspring whole-body and tissue-specific metabolism in livestock species1,2. J. Anim. Sci. 2019;97:3142–3152. doi: 10.1093/jas/skz157. - DOI - PMC - PubMed
    1. Burdge G.C., Lillycrop K.A. Fatty acids and epigenetics. Curr. Opin. Clin. Nutr. Metab. Care. 2014;17:156–161. doi: 10.1097/MCO.0000000000000023. - DOI - PubMed
    1. Lee H.S. Impact of Maternal Diet on the Epigenome during In Utero Life and the Developmental Programming of Diseases in Childhood and Adulthood. Nutrients. 2015;7:9492–9507. doi: 10.3390/nu7115467. - DOI - PMC - PubMed

LinkOut - more resources