. 2025 Aug 5;26(15):7567.
doi: 10.3390/ijms26157567.

A Bifunctional Anti-PD-1/TGF-β Fusion Antibody Restores Antitumour Immunity and Remodels the Tumour Microenvironment

Affiliations

A Bifunctional Anti-PD-1/TGF-β Fusion Antibody Restores Antitumour Immunity and Remodels the Tumour Microenvironment

Lidi Nan et al. Int J Mol Sci. .

Abstract

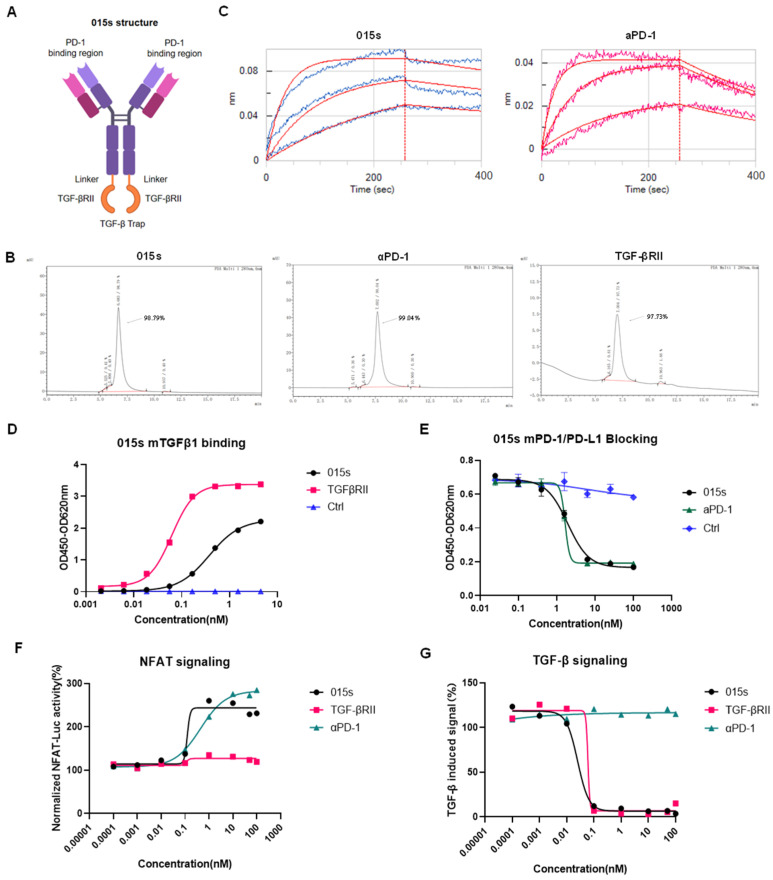
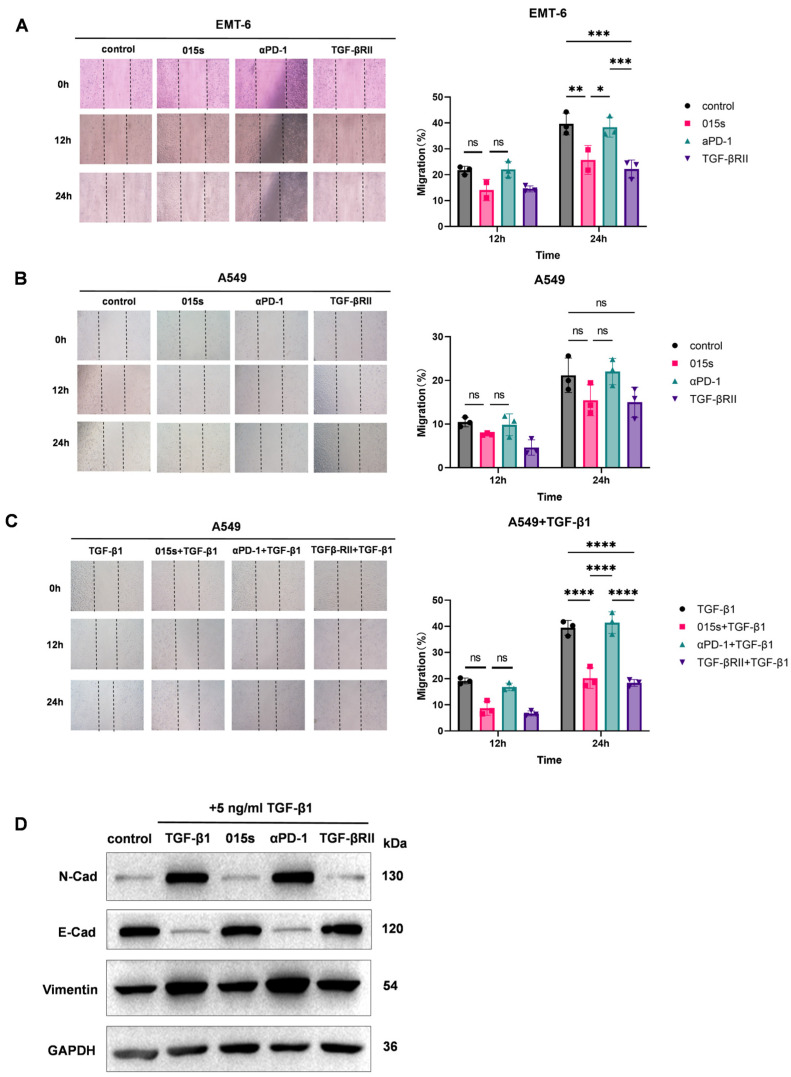
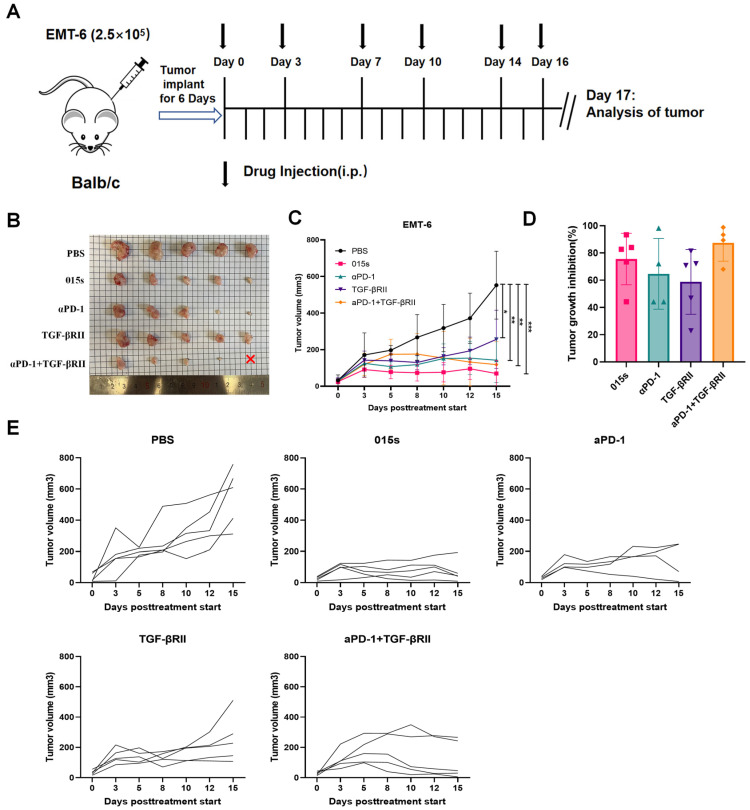
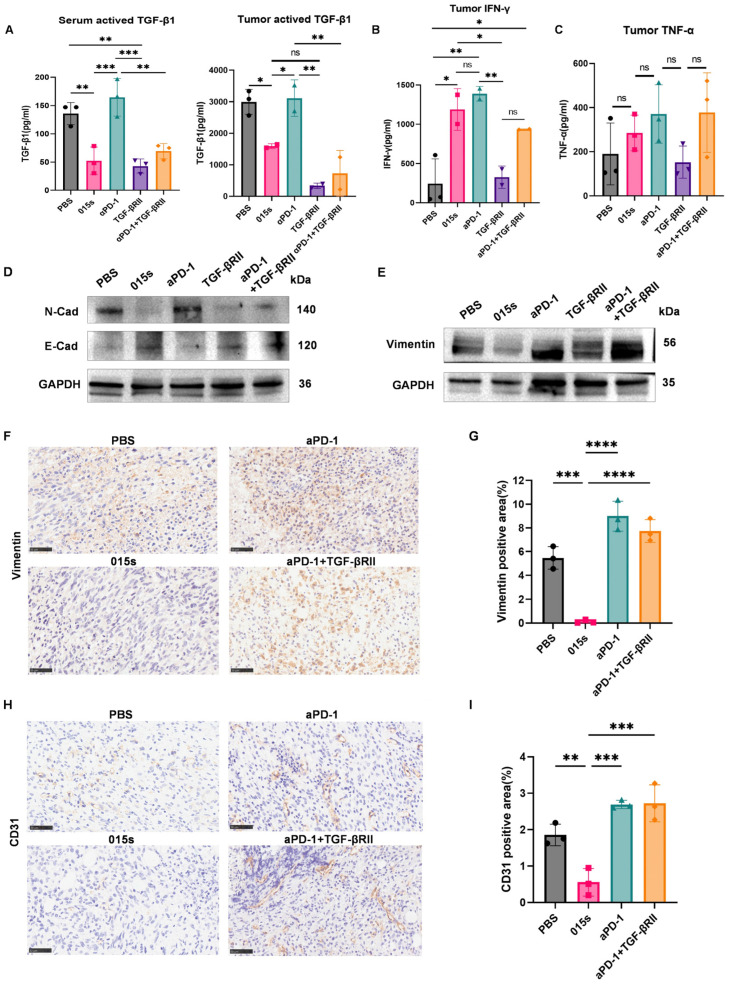
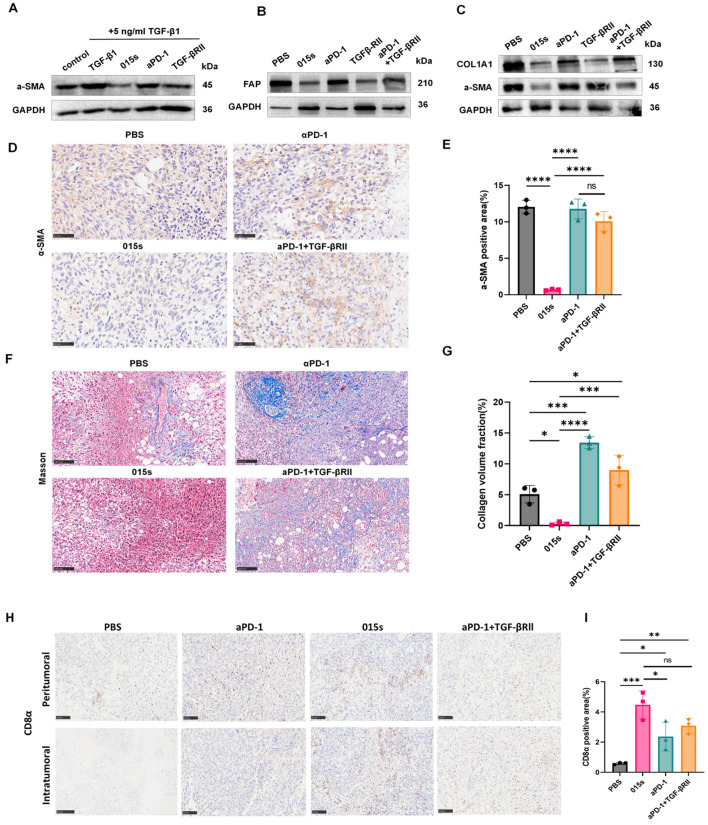
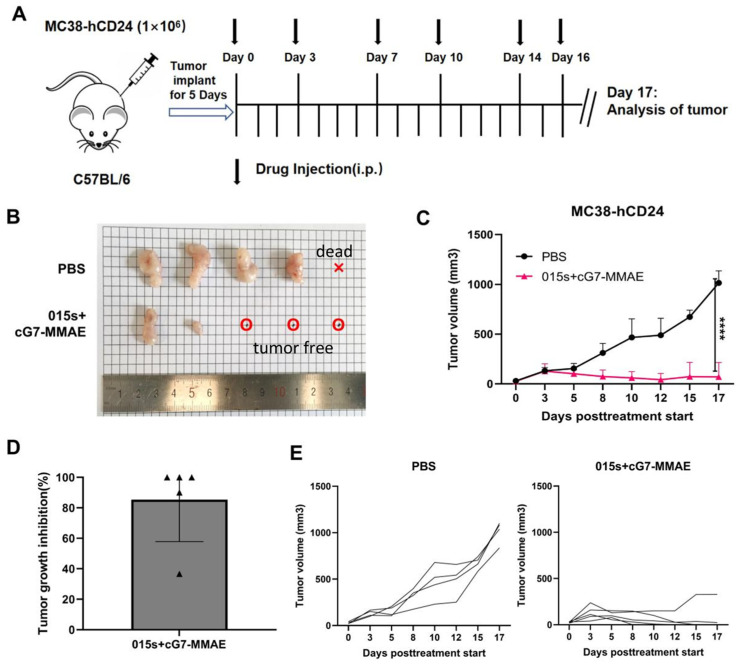
Although PD-1/PD-L1 inhibitors have transformed cancer immunotherapy, a substantial proportion of patients derive no clinical benefit due to resistance driven by the tumour microenvironment (TME). Transforming growth factor-β (TGF-β) is a key immunosuppressive cytokine implicated in this resistance. Several bifunctional antibodies that co-target PD-1 and TGF-β signalling have entered clinical trials and shown encouraging efficacy, but the mechanistic basis of their synergy is not fully understood. Here, we engineered 015s, a bifunctional fusion antibody that simultaneously targets murine PD-1 and TGF-β and evaluated its antitumour efficacy and mechanistic impact in pre-clinical models. Antibody 015s exhibited high affinity, dual target binding, and the effective inhibition of PD-1 and TGF-β signalling. In vivo, 015s significantly suppressed tumour growth compared with anti-mPD-1 or TGF-β receptor II (TGF-βRII) monotherapy. When combined with the CD24-targeted ADC, 015s produced even greater antitumour activity and achieved complete tumour regression. Mechanistic studies demonstrated that 015s significantly reduced tumour cell migration and invasion, reversed epithelial-mesenchymal transition (EMT), decreased microvascular density, and attenuated collagen deposition within the TME. Antibody 015s also decreased bioactive TGF-β1 and increased intratumoural IFN-γ, creating a more immunostimulatory milieu. These findings support further development of PD-1/TGF-β bifunctional antibodies for cancers with high TGF-β activity or limited response to immune checkpoint blockade.

Keywords: PD-1; TGF-β; bifunctional fusion antibody; cancer immunotherapy.


Conflict of interest statement

Dr. Xiao Huang, Dr. Xiaoqiang Kang, and Dr. Hong Ling were employed by Nanjing Leads Biolabs Co., Ltd., Nanjing, China. The authors declare that this research was conducted in the absence of any commercial or financial relationships that could be construed as a potential conflict of interest. They had no role in the study design; data collection, analysis, or interpretation; manuscript writing; or the decision to publish the results.

Figures

Figure 1
Figure 1
Antibody 015s binds PD-1 and TGF-β with high specificity in vitro, activates T cells, and inhibits TGF-β signalling in vitro. (A) Schematic representation of 015s, a bifunctional fusion antibody comprising a human/mouse cross-reactive anti-PD-1 mAb bearing an mIgG2a-LALA Fc domain, fused to the extracellular domain of human TGF-βRII to form a TGF-β trap. (B) Size-exclusion HPLC profiles of 015s, anti-PD-1, and TGF-βRII. Protein purity was determined based on the percentage of the main peak at its respective retention time. The x-axis shows retention time (min), and the y-axis shows absorbance (mAU). (C) Bio-layer interferometry binding kinetics of 015s and anti-PD-1 to recombinant mouse PD-1. Equilibrium dissociation constants (KD) were calculated using a 1:1 binding model (Octet software). The fluctuating line represents the raw detection signal, whereas the smooth line denotes the fitted curve. (D) ELISA showing concentration-dependent binding of 015s and TGF-βRII to plate-immobilised mTGF-β1 (n = 2). (E) Competitive ELISA evaluating the ability of 015s and anti PD-1 to inhibit the interaction between mPD-1 and mPD-L1. Serial dilutions of samples were pre-incubated with mPD-1 prior to application to mPD-L1-coated plates (n = 2). (F) Jurkat-hPD-1-NFAT-Luc was co-cultured with CHO-K1-OKT3-hPD-L1 cells at a 2:1 ratio for 6 h in the presence of serial dilutions of 015s, anti-PD-1, or TGF-βRII. Luciferase activity (RLU) was measured and normalised to maximum signal (n = 3). (G) HEK-293T-SEB-Luc cells were treated with graded concentrations of 015s, anti-PD-1, or TGF-βRII in the presence of recombinant human TGF-β1 (10 ng/mL) for 16 h. Luciferase activity was used to quantify TGF-β signalling inhibition (n = 3).
Figure 2
Figure 2
Antibody 015s inhibits tumour cell migration and TGF-β-induced epithelial–mesenchymal transition in vitro. (AC). Wound-healing assays were performed on EMT-6 (A) and A549 (B,C) cells treated with 015s, parental anti-PD-1, TGF-βRII, or combinations thereof in the absence or presence of TGF-β1 (5 ng/mL). Representative images (×100) were captured at 0, 12, and 24 h post scratch. Migration was quantified as the percentage of wound closure relative to 0 h (right panels). Data are mean ± SEM (n = 3). NS, not significant (p > 0.05); * p < 0.05; ** p < 0.01; *** p < 0.001; **** p < 0.0001. (D) Western blot analysis of EMT markers in A549 cells treated with TGF-β1 (5 ng/mL) and 015s, anti-PD-1, or TGF-βRII for 48 h. Expression of N-cadherin, E-cadherin, and Vimentin was assessed, and GAPDH served as a loading control.
Figure 3
Figure 3
Antibody 015s markedly inhibits tumour growth in an orthotopic EMT-6 breast tumour model. BALB/c mice were orthotopically implanted with 2.5 × 10⁵ EMT-6 cells into the right mammary fat pad. Treatment commenced once tumours reached 50–100 mm3 in volume, and tumour volumes were measured every 1–2 days. Mice were euthanised on day 17, one day after the final dose was administered. (A) Experimental timeline and intraperitoneal dosing schedule; 015s was administered at 10 mg/kg every 2–3 days for a total of six doses. Equimolar comparator treatments included anti-PD-1 (αPD-1, 8.1 mg/kg), TGF-βRII (9.6 mg/kg), or a combination of αPD-1 (8.1 mg/kg) + TGF-βRII (4.8 mg/kg) administered with the same schedule. (B) Photographs of all excised tumours at endpoint. The red × denotes an animal in the combination group that died unexpectedly prior to tumour collection. (C) Mean tumour volume over time. (D) Tumour growth inhibition at endpoint. (E) Individual tumour growth curves for each mouse. Data represent mean ± SEM (n = 5). * p < 0.05; ** p < 0.01; *** p < 0.001.
Figure 4
Figure 4
Antibody 015s reduces TGF-β1 levels, enhances intratumoural cytokine production, reverses tumour cell EMT, and limit angiogenesis in the EMT-6 tumour model. Circles represent the PBS group, squares represent the 015 s group, upward-pointing triangles represent the aPD-1 group, downward-pointing triangles represent the TGF-βRII group and diamonds represent the aPD-1+TGF-βRII group. (AC) Cytokine levels in serum and tumour homogenates were quantified by ELISA. (A) Active TGF-β1 quantified in undiluted serum and 5-fold-diluted tumour supernatants using pre-coated capture antibody plates. (B) IFN-γ measured in 10-fold-diluted tumour supernatants. (C) TNF-α measured in 5-fold-diluted tumour supernatants. (D,E) Western blot analysis of EMT markers E-cadherin, Vimentin, and N-cadherin with GAPDH as a loading control in EMT-6 tumours. (FI) Immunohistochemistry (IHC) of EMT and angiogenesis markers in EMT-6 tumours (400×; scale bar: 50 µm). (F,G) Representative images of Vimentin IHC and quantification of Vimentin-positive tumour area. (H,I) Representative images of CD31 IHC and quantification of CD31-positive area as a measure of tumour vascularisation. Data are presented as mean ± SD (n = 3); ns, not significant (p > 0.05); * p < 0.05; ** p < 0.01, *** p < 0.001, and **** p < 0.0001. Circles represent the PBS group, squares represent the 015 s group, triangles represent the aPD-1 group and diamonds represent the aPD-1+TGF-βRII group.
Figure 5
Figure 5
Antibody 015s reduces α-SMA and collagen deposition, curtails CAF activity, and mitigates tumour fibrosis. (A) In vitro assessment of myofibroblast differentiation. MRC-5 fibroblasts were stimulated with TGF-β1 (5 ng/mL) and treated for 48 h with 015s, anti-PD-1 or TGF-βRII. Total protein lysates were analysed by Western blotting for α-SMA to evaluate the TGF-β-induced fibroblast-to-myofibroblast transition. (B,C) Western blot analysis of EMT-6 tumour lysates for CAF markers α-SMA and FAP (B), and ECM marker COL1A1 (C). (D,E) Representative IHC images for α-SMA (D) with quantification of α-SMA-positive area (E). (F,G) Masson’s trichrome staining for collagen fibres (F) and quantification of collagen volume fraction (G). (H,I) Representative images and quantitative analysis of anti-CD8α IHC in the mouse breast cancer model of EMT-6 (400×; scale bar: 50 µm). The results for each group are shown as mean ± SD (n = 3). ns, not significant (p > 0.05); * p < 0.05, ** p < 0.01, *** p < 0.001, and **** p < 0.0001. Circles represent the PBS group, squares represent the 015 s group, triangles represent the aPD-1 group and diamonds represent the aPD-1+TGF-βRII group.
Figure 6
Figure 6
The combination of 015s and ADC drugs demonstrated superior antitumour activity. Tumour volume of mice was measured every one to two days. The day after the end of dosing, the mice were euthanized. (A) Establishment of MC38-hCD24 tumour model and treatment plan. The injection dose of 015s is 10 mg/kg, and the injection dose of the ADC drug cG7-MMAE is 0.5 mg/kg. The dosing sequence was intraperitoneal injection of cG7-MMAE, followed by 015s after an interval of half an hour and administered every 2 or 3 days, a total of 6 times. (BE) On day 0, 1 × 10⁶ MC38-hCD24 cells were inoculated subcutaneously in the right axillary arm of C57BL/6 mice. Treatment started on day 6. The representative images of tumours, tumour growth curves, tumour inhibition rates, and tumour growth curve data for each mouse in each dosing group of mice treated with 015s + cG7-MMAE and controls are shown. The results for each group are shown as mean ± SD (n = 3). **** p < 0.0001.

Similar articles

Cited by

References

    1. Sharma P., Goswami S., Raychaudhuri D., Siddiqui B.A., Singh P., Nagarajan A., Liu J., Subudhi S.K., Poon C., Gant K.L., et al. Immune checkpoint therapy-current perspectives and future directions. Cell. 2023;186:1652–1669. doi: 10.1016/j.cell.2023.03.006. - DOI - PubMed
    1. Boussiotis V.A. Molecular and Biochemical Aspects of the PD-1 Checkpoint Pathway. N. Engl. J. Med. 2016;375:1767–1778. doi: 10.1056/NEJMra1514296. - DOI - PMC - PubMed
    1. Zitvogel L., Kroemer G. Targeting PD-1/PD-L1 Interactions for Cancer Immunotherapy. Oncoimmunology. 2012;1:1223–1225. doi: 10.4161/onci.21335. - DOI - PMC - PubMed
    1. Liu Z., Yu X., Xu L., Li Y., Zeng C. Current Insight into the Regulation of PD-L1 in Cancer. Exp. Hematol. Oncol. 2022;11:44. doi: 10.1186/s40164-022-00297-8. - DOI - PMC - PubMed
    1. Sun C., Mezzadra R., Schumacher T.N. Regulation and Function of the PD-L1 Checkpoint. Immunity. 2018;48:434–452. doi: 10.1016/j.immuni.2018.03.014. - DOI - PMC - PubMed

LinkOut - more resources