. 2025 Aug 6;26(15):7599.
doi: 10.3390/ijms26157599.

The Catalyzing Effect of Aggregates on the Fibrillation Pathway of Human Insulin: A Spectroscopic Investigation During the Lag Phase

Affiliations

The Catalyzing Effect of Aggregates on the Fibrillation Pathway of Human Insulin: A Spectroscopic Investigation During the Lag Phase

Giorgia Ciufolini et al. Int J Mol Sci. .

Abstract

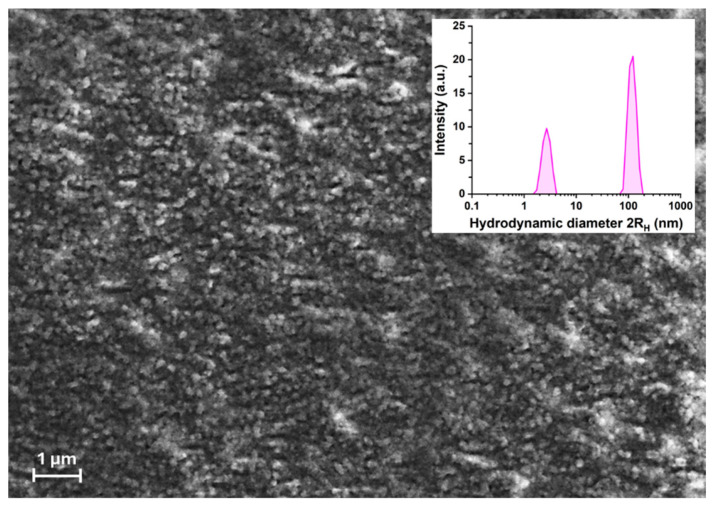
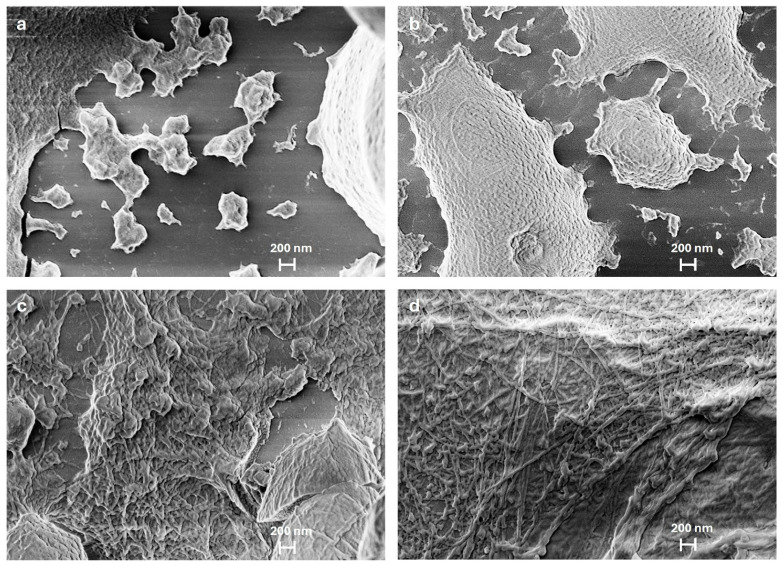
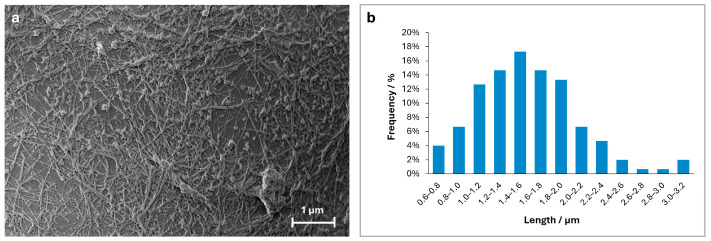
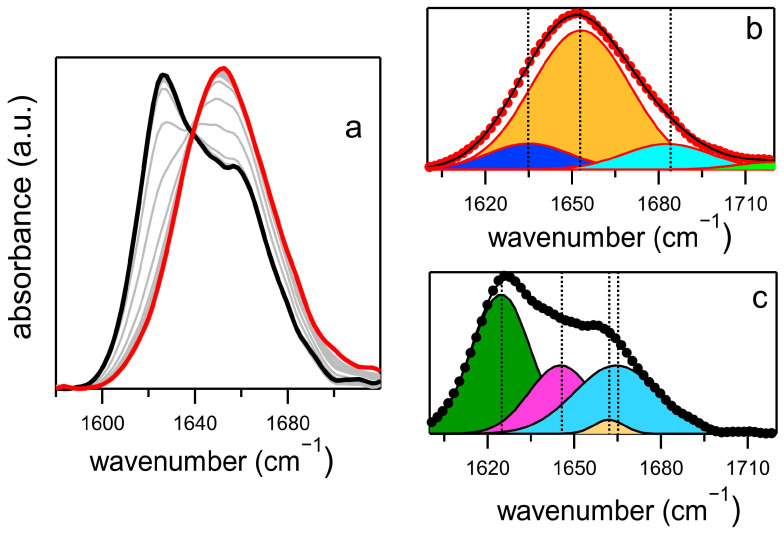
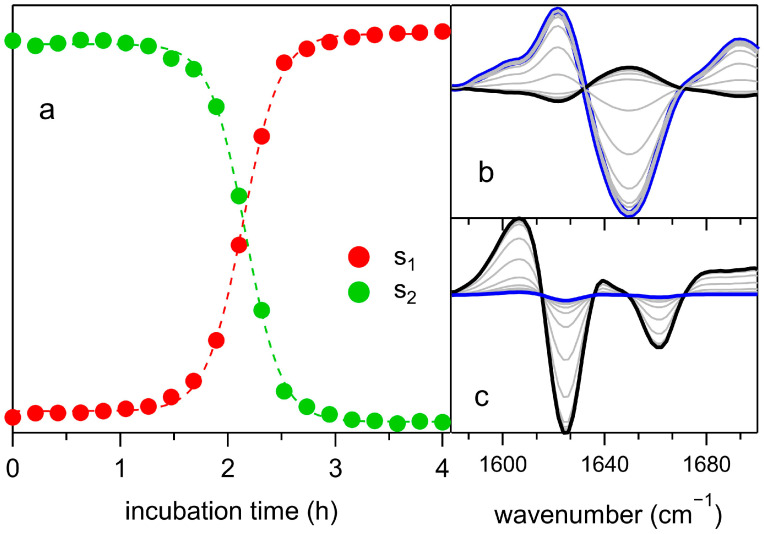
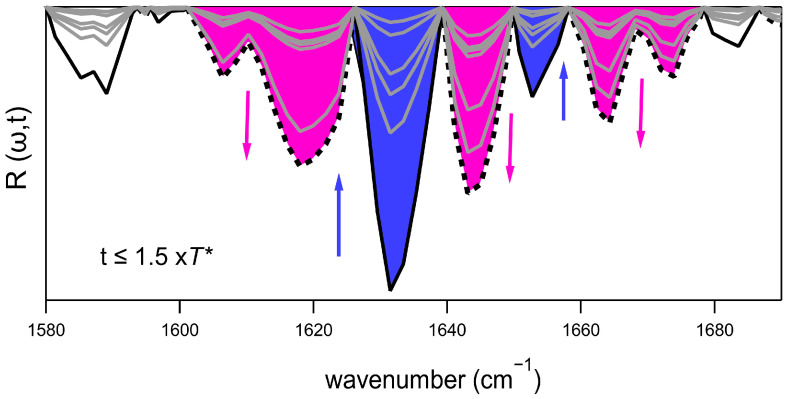
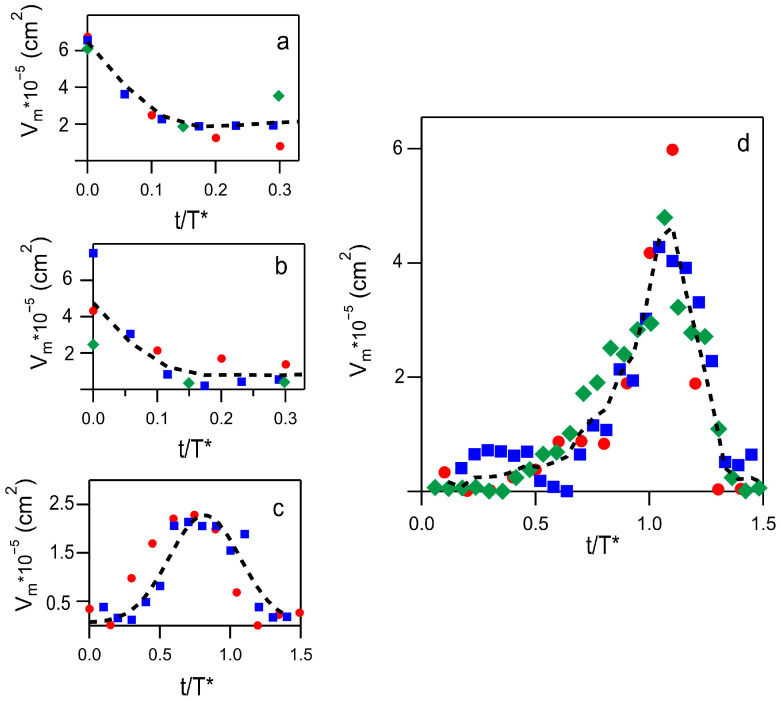
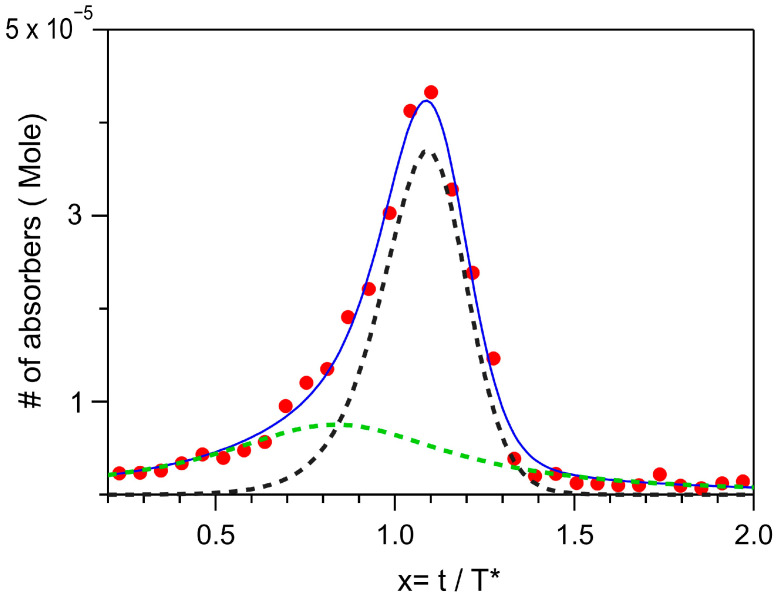
The kinetics of insulin aggregation and fibril formation were studied in vitro using Scanning Electron Microscopy (SEM) and Fourier Transform Infrared (FTIR) spectroscopy. Our investigation centered on the protein's morphological and structural changes to better understand the transient molecular configurations that occur during the lag phase. SEM images showed that, already at early incubation stages, a network of disordered pseudo-filaments, ranging in length between 200 and 500 nanometers, develops on the surface of large aggregates. At later stages, fibrils catalyzed by protein aggregates were observed. Principal Component Analysis (PCA) of the FTIR data identified signatures of intramolecular β-sheet secondary structures forming during the lag phase and at the onset of the exponential growth phase. These absorption bands are linked to secondary nucleation mechanisms due to their transient nature. This interpretation is further supported by a chemical equilibrium model, which yielded a reliable secondary nucleation rate constant, K2, on the order of 104 M-2 s-1.

Keywords: amyloid fibrils; insulin; lag phase; secondary nucleation.


Conflict of interest statement

The authors declare no conflicts of interest.

Figures

Figure 1
Figure 1
SEM image at time zero: small oligomers representing the early oligomeric state. The inset shows the hydrodynamic diameter (2RH) from DLS measurements of the insulin solution prior to incubation. Two populations (purple histograms) are observed, with 2RH values of 2.7 ± 0.5 nm and 119.0 ± 20.0 nm, each with a polydispersity index (PDI) of 0.03. Size distribution was determined by intensity-weighted analysis using the NNLS algorithm.
Figure 2
Figure 2
SEM images of insulin incubation at different time points: (a) 20 min: Small aggregates with a smooth surface, beginning of protein aggregation; (b) 60 min: Increase in aggregate size and in the surface corrugation; (c) 100 min: Onset of mature fibril formation; (d) 140 min: Elongation of mature fibrils.
Figure 3
Figure 3
Panel (a) Mature fibrils formed after 140 min of insulin incubation. Panel (b) Histogram of fibril length distribution, showing the percentage of fibrils within each length interval (measured in μm).
Figure 4
Figure 4
(a) Time evolution of the amide I band of human insulin. The absorption spectrum at t = 0 is reported in red, that acquired after 4 h in black. Gray curves represent absorption spectra at intermediate times. (b) Gaussian deconvolution of the t = 0 spectrum. The orange-filled curve represents the α-helix contribution, the cyan one the loops and turns secondary structures and the blue curve the β-sheet contribution. (c) Spectral deconvolution at the final stage of incubation. Green and purple filled curves represent the fibril β-parallel and the random coil secondary structures, respectively. Vertical dashed lines in panels (b,c) indicate the central frequencies of the Gaussian contributions.
Figure 5
Figure 5
PCA analysis of the FTIR spectra. (a) Scores s1 (red) and s2 (green) reported vs. time. Fit to data are performed according to Equation (3). (b,c) Time evolution of the quantities s2tL2ω (b) and s1tL1ω (c), respectively. The blue spectrum corresponds to the initial state, the black one to the final. Gray spectra refer to intermediate incubation times.
Figure 6
Figure 6
Evolution of the higher orders of the PCA expansion during the lag and the exponential growth phase for incubation times less than 1.5 × T* (T* = fibrillation half-time). The solid black spectrum refers to Rω,t=0  while the dashed black one is Rω,t=1.5×T. The gray spectra refer to Rω,t at intermediate times. The arrows indicate the behavior of the minima vs. time. The blue-filled minima highlight the progressive decrease of the spectral contributions, the purple-filled ones the contributions that increase with time.
Figure 7
Figure 7
Time evolution of the minima Vm (absolute values) as obtained from different experiments and reported with different symbols and colors (green diamonds, red circles and blue squares). (a) Vm for a-helix secondary structures. (b) Vm for the dimer’s contribution at 1633 cm−1. Fit to data in a and b (dashed curves) provided a damping rate of 0.1T* for both contributions. (c) Vm data for the oligomer’s contribution. (d) Vm values obtained in the 1600–1620 cm−1 spectral region. The dashed curves in panels c and d are averages of all experimental data.
Figure 8
Figure 8
Average Vm curve (red dots) together with the best fit to data (blue line). The green dashed curve is a Lorentzian line; the black dashed line is a curve according to Equation (4) with n = 2. For the details of the fitting procedure, refer to Supplementary Materials.

Similar articles

References

    1. Kumar V., Sami N., Kashav T., Islam A., Ahmad F., Hassan M.I. Protein Aggregation and Neurodegenerative Diseases: From Theory to Therapy. Eur. J. Med. Chem. 2016;124:1105–1120. doi: 10.1016/j.ejmech.2016.07.054. - DOI - PubMed
    1. Chiti F., Dobson C. Protein Misfolding, Amyloid Formation, and Human Disease: A Summary of Progress Over the Last Decade. Annu. Rev. Biochem. 2017;86:27–68. doi: 10.1146/annurev-biochem-061516-045115. - DOI - PubMed
    1. Kurouski D., Van Duyne R.P., Lednev I.K. Exploring the Structure and Formation Mechanism of Amyloid Fibrils by Raman Spectroscopy: A Review. Analyst. 2015;140:4967–4980. doi: 10.1039/C5AN00342C. - DOI - PubMed
    1. Martial B., Lefèvre T., Auger M. Understanding Amyloid Fibril Formation Using Protein Fragments: Structural Investigations via Vibrational Spectroscopy and Solid-State NMR. Biophys. Rev. 2018;10:1133–1149. doi: 10.1007/s12551-018-0427-2. - DOI - PMC - PubMed
    1. Zhao R., So M., Maat H., Ray N.J., Arisaka F., Goto Y., Carver J.A., Hall D. Measurement of Amyloid Formation by Turbidity Assay—Seeing through the Cloud. Biophys. Rev. 2016;8:445–471. doi: 10.1007/s12551-016-0233-7. - DOI - PMC - PubMed

LinkOut - more resources