. 2025 Aug 7;26(15):7651.
doi: 10.3390/ijms26157651.

Multi-Component Synthesis of New Fluorinated-Pyrrolo[3,4- b]pyridin-5-ones Containing the 4-Amino-7-chloroquinoline Moiety and In Vitro-In Silico Studies Against Human SARS-CoV-2

Affiliations

Multi-Component Synthesis of New Fluorinated-Pyrrolo[3,4- b]pyridin-5-ones Containing the 4-Amino-7-chloroquinoline Moiety and In Vitro-In Silico Studies Against Human SARS-CoV-2

Roberto E Blanco-Carapia et al. Int J Mol Sci. .

Abstract

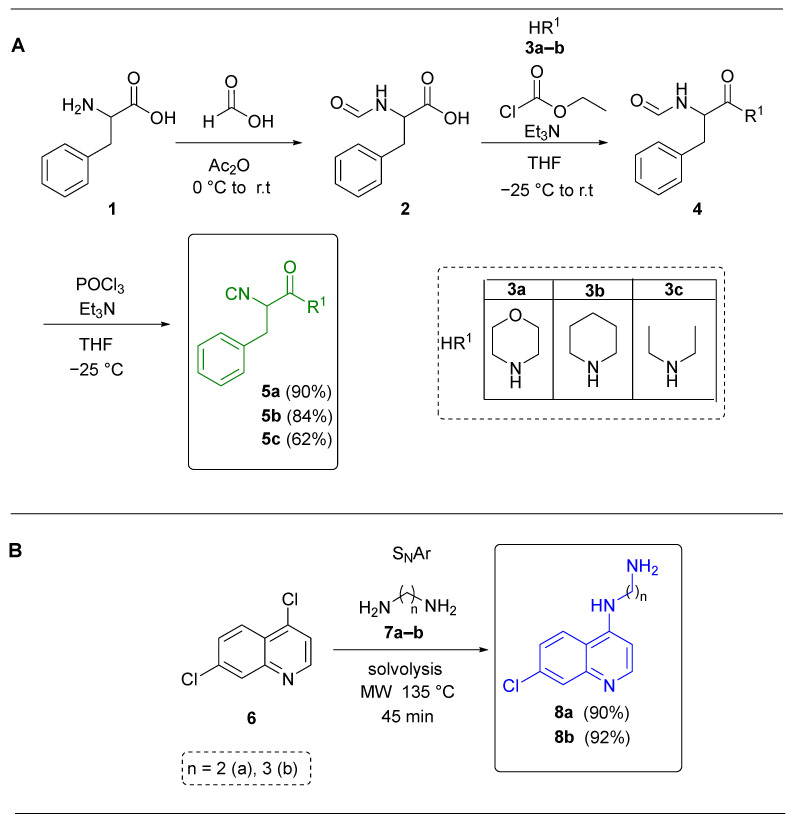
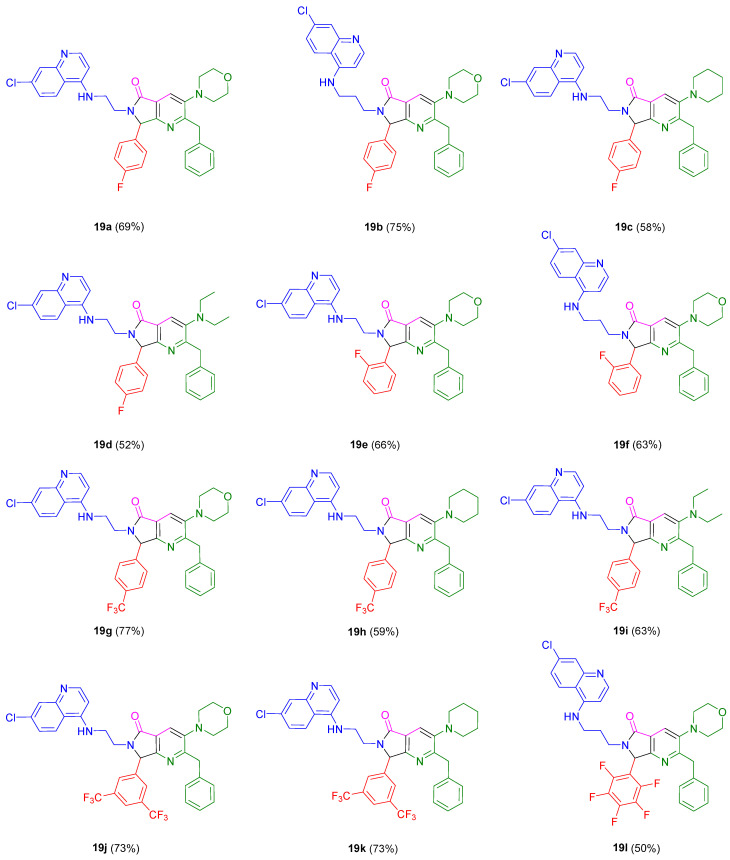
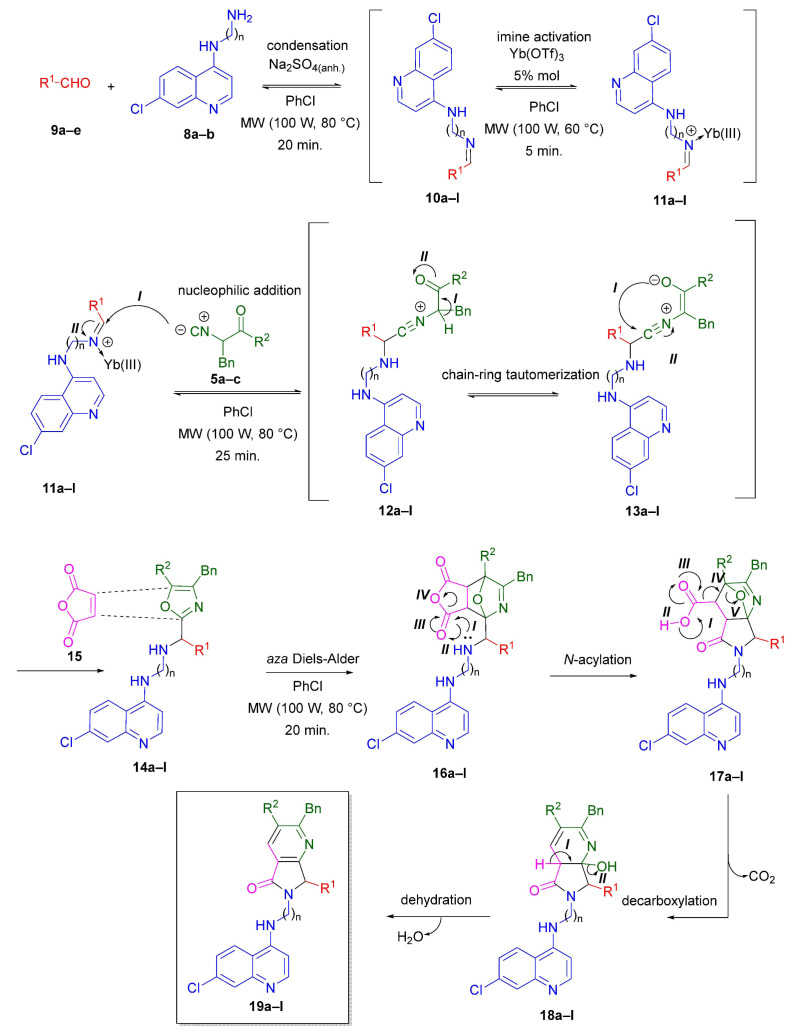
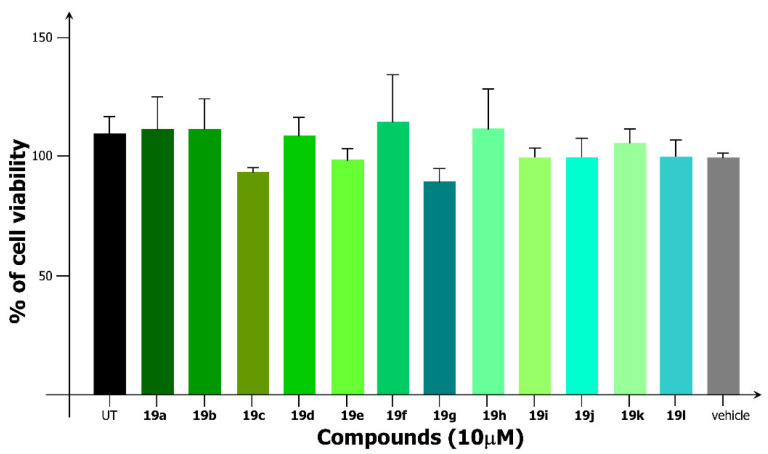
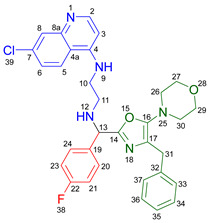
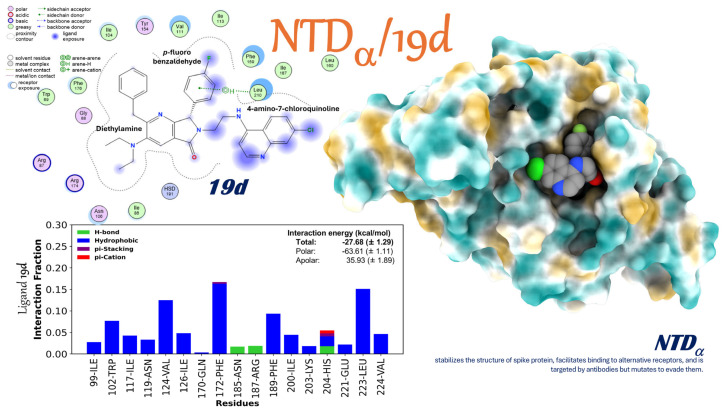
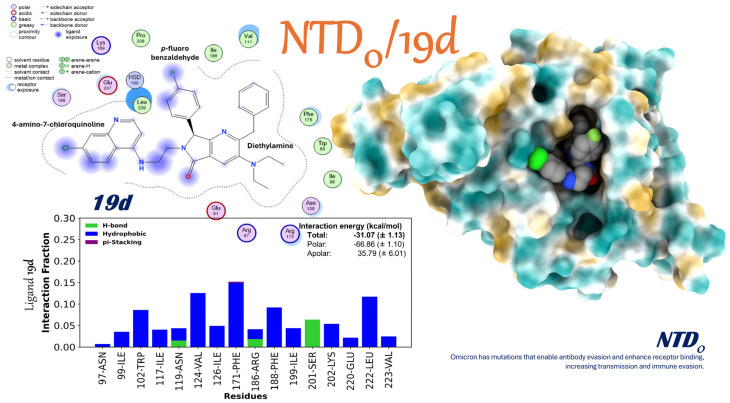
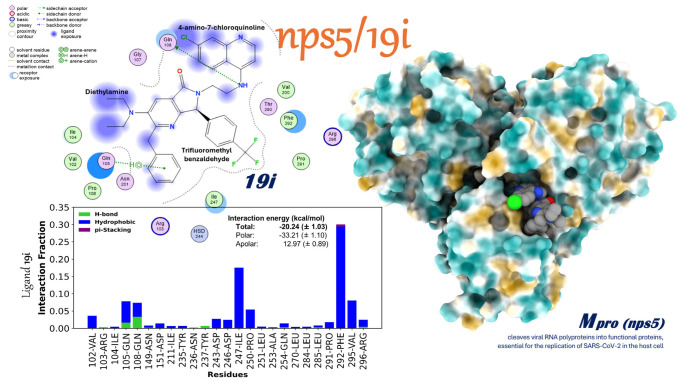
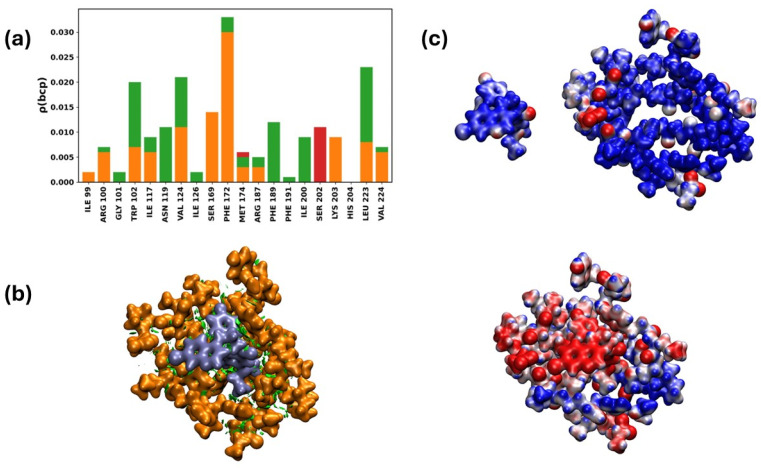
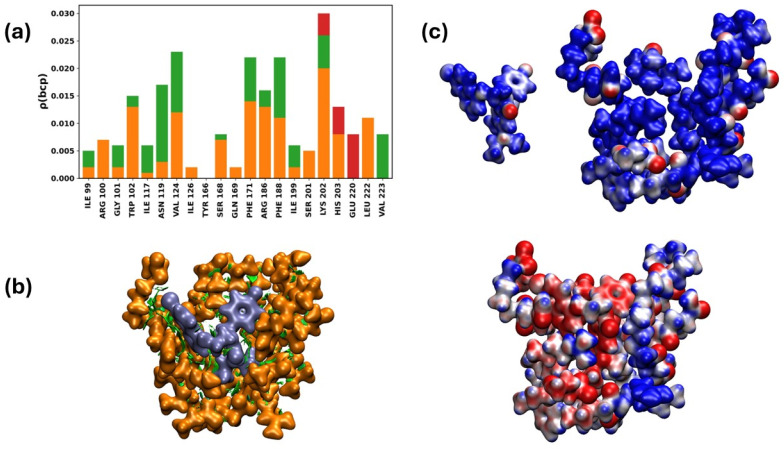
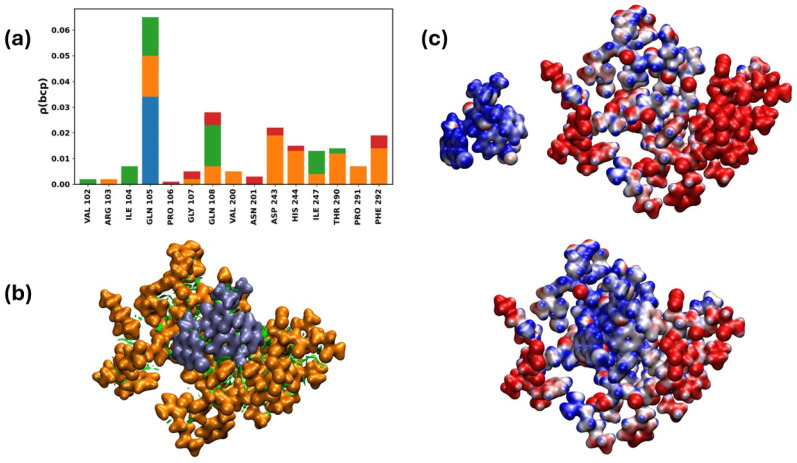
A one-pot synthetic methodology that combines an Ugi-Zhu three-component reaction (UZ-3CR) with a cascade sequence (intermolecular aza Diels-Alder cycloaddition/intramolecular N-acylation/decarboxylation/dehydration) using microwave-heating conditions, ytterbium (III) triflate (Yb(OTf)3) as the catalyst, and chlorobenzene (for the first time in a multi-component reaction (MCR)) as the solvent, was developed to synthesize twelve new fluorinated-pyrrolo[3,4-b]pyridin-5-ones containing a 4-amino-7-chloroquinoline moiety, yielding 50-77% in 95 min per product, with associated atom economies around 88%, also per product. Additionally, by in vitro tests, compounds 19d and 19i were found to effectively stop early SARS-CoV-2 replication, IC50 = 6.74 µM and 5.29 µM, at 0 h and 1 h respectively, while cell viability remained above 90% relative to the control vehicle at 10 µM. Additional computer-based studies revealed that the most active compounds formed strong favorable interactions with important viral proteins (Mpro, NTDα and NTDo) of coronavirus, supporting a two-pronged approach that affects both how the virus infects the cells and how it replicates its genetic material. Finally, quantum chemistry analyses of non-covalent interactions were performed from Density-Functional Theory (DFT) to better understand how the active compounds hit the virus.

Keywords: SARS-CoV-2; antiviral activity; drug design; fluorinated-compounds; multi-component reactions; polyheterocycles; pyrrolo[3,4-b]pyridin-5-ones; quinoline.


Conflict of interest statement

The author Nancy Viridiana Estrada-Toledo is employed by Health Pharma Professional Research S.A de C.V. The remaining authors declare that the research was conducted in the absence of any commercial or financial relationships that could be construed as a potential conflict of interest. The funders had no role in the design of the study; in the collection, analyses, or interpretation of data; in the writing of the manuscript; or in the decision to publish the results.

Figures

Scheme 1
Scheme 1
(A) Synthesis of α-isocyanoacetamides. (B) Synthesis of 4-amino-7-chloroquinolines. Color key: green (isocyanide moiety) and blue (amine moiety).
Figure 1
Figure 1
Synthesized and assayed fluorine-containing 4-amino-7-chloroquinoline-pyrrolo[3,4-b]pyridin-5-ones. Color key: red (aldehyde moiety), blue (amine moiety), green (isocyanide moiety) and pink (anhydride moiety).
Scheme 2
Scheme 2
Plausible reaction mechanism to access to the polyheterocycles 19a–l. Color key: red (aldehyde moiety), blue (amine moiety), green (isocyanide moiety) and pink (anhydride moiety).
Figure 2
Figure 2
Cell viability assay. The experiment was conducted twice independently, each time in triplicate. Bars represent the standard deviation of the mean (n = 6); UT: Untreated; Vehicle: DMSO.
Figure 3
Figure 3
Inhibition of SARS CoV-2 infection. (A) Addition of compounds at the time of infection (0 h). (B) Addition of compounds 1 h postinfection. Plaque assay technique was conducted twice independently, each time in triplicate. Bars represent the standard deviation of the mean (n = 6). **** p-value < 0.0001, determined using ordinary one-way ANOVA; PFU/mL: Plaque-forming units/mL; UT: Untreated; Vehicle: DMSO.
Figure 4
Figure 4
NTDα/19d Complex. The 2D picture in the upper left corner shows the chemical structure of 19d. It shows the non-covalent interactions (hydrogen bonds, hydrophobic interactions, π–π interactions, etc.) between the Spike protein’s NTD residues and the Spike protein’s Alpha form. The histogram (bottom left) illustrates the contact fraction for each residue, prominently featuring Tyr102, Phe172, Gln170, and Leu223, among others. On the right, the NTDα surface is depicted, colored according to its hydrophobicity (blue: hydrophilic, orange: hydrophobic, white: neutral), with 19d docking into a superficial cavity. The total energy value is −27.68 ± 1.29 kcal/mol, with −63.61 ± 1.11 kcal/mol polar and +35.93 ± 1.89 kcal/mol apolar. This shows a stable binding that may affect Spike’s extra function and the virus’s ability to hide from the immune system.
Figure 5
Figure 5
NTDo/19d Complex. A 2D picture (upper left) shows the chemical structure of 19d and the non-covalent interactions (hydrogen bonds, hydrophobic interactions, π–π interactions, etc.) that it has with NTD residues in the Omicron version. The histogram (bottom left) illustrates the proportion of time each residue (e.g., Asn97, Ser98, Ile112, Tyr167, Arg186) maintains contact with the ligand. The right picture shows the NTDo surface. The colors show whether it is hydrophilic or hydrophobic (blue means hydrophilic, orange means hydrophobic, and white means neutral). This shows where 19d fits into a shallow cavity. The energy breakdown (total: −31.07 ± 1.13 kcal/mol; polar: −66.86 ± 1.10 kcal/mol; apolar: +35.79 ± 6.01 kcal/mol) shows a strong interaction, which means that 19d can bind even in areas that have been changed to avoid antibodies while improving its affinity for cellular receptors.
Figure 6
Figure 6
Mpro/19i Complex. The top left corner of the 2D picture displays the chemical structure of 19i. Some of the non-covalent interactions that it has with the residues of the major protease (Mpro/nsp5) are shown in this structure. These include hydrogen bonds, hydrophobic interactions, π–π interactions, and more. The histogram (bottom left) illustrates the proportion of time each residue remains in contact with the ligand, emphasizing the significance of Phe292, Val295, Leu253, and Gln105, among others. The Mpro surface is shown on the right, with a color key that show hydrophobicity (blue = hydrophilic, orange = hydrophobic, and white = neutral). This diagram shows where 19i is located inside the protein cavity. It is supported by the energy decomposition (−20.24 ± 1.03 kcal/mol total; −33.21 ± 1.10 kcal/mol polar; +12.97 ± 0.89 kcal/mol apolar), which indicates that 19i stays bound. This phenomenon could stop the viral proteolysis that is needed for SARS-CoV-2 replication.
Figure 7
Figure 7
NTDα/19d Complex. (a) The upper left histogram of the QTAIM analysis for each residue shows the electron density involved in each interaction. Orange color indicates non-standard hydrogen bonds, green indicates H⋯H interactions, and red is associated with Lewis-type interactions. (b) NCI isosurfaces in green color (lower left) show dispersive interactions between ligand and receptor. (c) MEP for isolated systems and for the whole system. Negative values in red color and positive values in blue color.
Figure 8
Figure 8
NTDo/19d Complex. (a) The upper left histogram of the QTAIM analysis for each residue shows the electron density involved in each interaction. Orange color indicates non-standard hydrogen bonds, green indicates H⋯H interactions, and red is associated with Lewis-type interactions. (b) NCI isosurfaces in green color (lower left) show dispersive interactions between ligand and receptor. (c) MEP for isolated systems and for the whole system. Negative values in red color and positive values in blue color.
Figure 9
Figure 9
nsp5/19i Complex. (a) The upper left histogram of the QTAIM analysis for each residue shows the electron density involved in each interaction. Blue color indicates regular hydrogen bonds, orange indicates non-standard hydrogen bonds, green indicates H⋯H interactions, and red is associated with Lewis-type interactions. (b) NCI isosurfaces in green color (lower left) show dispersive interactions between ligand and receptor. (c) MEP for isolated systems and for the whole system. Negative values in red color and positive values in blue color.

Similar articles

References

    1. Evans B.E., Rittle K.E., Bock M.G., DiPardo R.M., Freidinger R.M., Whiter W.L., Lundell G.F., Veber D.F., Anderson P.S., Chang R.S.L., et al. Methods for drug discovery: Development of potent, selective, orally effective cholecystokinin antagonists. J. Med. Chem. 1988;31:2235–2246. doi: 10.1021/jm00120a002. - DOI - PubMed
    1. Kim J., Kim H., Park S.B. Privileged Structures: Efficient Chemical “Navigators” toward Unexplored Biologically Relevant Chemical Spaces. J. Am. Chem. Soc. 2014;136:14629–14638. doi: 10.1021/ja508343a. - DOI - PubMed
    1. Patchett A.A., Nargund R.P. Chapter 26. Privileged structures-An update. Annu. Rep. Med. Chem. 2000;35:289–298.
    1. Schneider P., Schneider G. Privileged Structures Revisited. Angew. Chem. Int. Ed. 2017;56:7971–7974. doi: 10.1002/anie.201702816. - DOI - PMC - PubMed
    1. Barreiro E.J. Privileged Scaffolds in Medicinal Chemistry: An introduction. In: Bräse S., editor. Privileged Scaffolds in Medicinal Chemistry: Design, Synthesis, Evaluation. Royal Society of Chemistry; Cambridge, UK: 2015. pp. 1–15.

Grants and funding

LinkOut - more resources